Auto Dealership Investments
Auto Dealership Properties in Florida
Large-format single-tenant NNN on high-traffic corridors
Auto dealership real estate is a specialty NNN category with large footprints (5–15+ acres), high-traffic highway locations, and long-term leases from franchise dealer groups. The category trades in the 6.5% – 8.0% range depending on franchise brand, dealer credit, and location. Strong dealer groups like Lithia, AutoNation, and Penske drive institutional demand.
Typical Deal Size
$8M – $40M
Single-tenant NNN dealership
Common Cap Rate
6.50% – 8.00%
Franchise dealer NNN leaseback
Site Size
5 – 15 acres
Showroom + service + inventory lot
Florida Retail Formats & Subtypes
Retail covers a dozen distinct investment profiles — from the quietest single-tenant NNN pad to the most complex regional mall. Here are the most actively traded formats in Florida today.
Single-Tenant NNN (Freestanding)
Drug stores, QSR pads, dollar stores, auto parts, and bank branches on 15–20 year absolute NNN leases. The passive-income workhorse of the asset class.
Multi-Tenant Strip / Neighborhood Center
3–15 tenant strips with a mix of daily-needs services. Higher cap rates compensate for more active landlord duties and rollover risk.
Grocery-Anchored Shopping Center
The institutional gold standard. Publix or Winn-Dixie anchor drives 40k+ weekly visits and supports shop-tenant rents.
Power Center / Big-Box Anchored
Category-killer boxes (Home Depot, Target, Ross) with junior anchors and pad sites.
Lifestyle / Mixed-Use Retail
Open-air upscale centers with restaurants, fitness, and experiential tenants. Strongest in affluent Orlando submarkets.
Pad Site / Outparcel
Drive-thru QSR, coffee, bank, and C-store pads carved from larger centers. Tightest caps in retail.
Why Florida Is a Top Dealership Market
Florida's auto market combines population growth, a large truck/SUV culture, retiree demand for premium vehicles, and no state income tax — creating one of the deepest auto sales markets in the country.
22M+ Registered Vehicles
Florida has one of the highest vehicle registration counts in the US, supporting consistent service department revenue that backs dealership lease economics.
Fastest-Growing State
Net in-migration of ~365,000/year brings new vehicle buyers, expands the addressable market, and supports dealer group expansion into new Florida corridors.
No State Income Tax
Florida attracts high-income households — the primary buyers of luxury and near-luxury vehicles. Premium franchise dealers perform best in high-HHI Florida markets.
Year-Round Sales
No winter seasonality means consistent monthly unit sales. Florida dealerships don't see the 30–40% winter dips common in northern markets.
EV Infrastructure Investment
Florida ranks in the top 5 for EV adoption. Franchise dealers are investing in Level 2/DC Fast charging — a capital event that adds value to the real estate.
Hurricane Replacement Demand
Post-hurricane vehicle replacement spikes support dealer sales. Florida's reinsurance-driven culture keeps vehicle replacement cycles shorter than the national average.
Auto Dealership Investing: Pros & Cons
Auto dealership real estate is not for every NNN investor. It rewards buyers who understand the franchise dealer credit ecosystem and the physical real estate's highest-and-best-use value as a floor.
Why Buy
High Barrier to Entry
Franchise dealer agreements, OEM approval, and site-specific real estate constraints create deep economic moats. It's extremely hard for a competitor to open across the street.
Land Value as Safety Net
Dealership sites — 5–15 acres on highway corridors — have significant redevelopment optionality. Even a dark dealership typically has strong retail/commercial land value.
Long-Term Leases
Franchise dealer leases typically run 15–20 years with options, providing long-duration income security for passive investors.
Above-Market Cap Rates
Dealerships trade at 6.5%–8.0% cap — meaningfully wider than QSR pads or drug stores — for investors who understand the credit and want better cash yield.
Mission-Critical Operations
Dealers invest $5M–$20M+ in OEM-required facility improvements, creating massive moving costs that lock the tenant in for decades.
What to Watch
Specialized Tenant Pool
If a franchise dealer exits, the replacement tenant pool is narrow. You're re-leasing to another franchise dealer, not a generic retailer.
EV Transition Uncertainty
As OEMs shift to EV-centric retailing models, some franchise distribution agreements may be renegotiated. Underwrite lease structure carefully.
Large Deal Size
Minimum deal size of $8M–$10M puts dealership NNN out of reach for many individual buyers without institutional capital or 1031 proceeds.
Thin Liquidity vs. QSR Pads
The buyer pool for dealership NNN is smaller than for pharmacy or QSR pads. Factor in longer marketing time on exit.
OEM Approval Required
Franchise transfer on a sale-leaseback or ownership change requires OEM consent — an added transaction complexity not present in other NNN categories.
Who Auto Dealership Is Best Suited For
1031 Exchange Buyers
High-Proceeds Rollover
Sellers of apartment buildings, industrial parks, or commercial land with $3M–$10M+ of equity to redeploy into a passive, management-free asset.
Why It Fits
The $10M–$30M deal size fits 1031 exchange buyers rolling out of large multi-tenant or development assets.
Family Offices & Trusts
Long Duration
Allocators with 20–30-year hold horizons who want inflation-protected income on a site with land value as a hard-asset floor.
Why It Fits
15–20-year primary terms with built-in escalations align with generational wealth mandates.
Passive Income Investors
Management-Free
High-net-worth individuals who want a true triple-net asset with zero landlord responsibilities and corporate-guaranteed rent.
Why It Fits
Absolute NNN dealership leases typically require zero landlord input for 15+ years.
Institutional Capital
Portfolio Scale
Private equity funds and non-traded REITs assembling dealership portfolios across multiple brands and markets.
Why It Fits
Sale-leaseback programs from Lithia, AutoNation, and Penske produce institutional-grade portfolio paper.
Major Auto Dealership Operators & Tenants
These are the major franchise dealer groups and OEM brands whose leasebacks drive the Florida auto dealership NNN market.
Lithia Motors
Largest US dealership group by revenue. Strong sale-leaseback program.
AutoNation
Fort Lauderdale-headquartered giant with heavy Florida footprint.
Penske Automotive
Luxury and premium franchise concentration. Strong credit.
Group 1 Automotive
National franchise group with Florida expansion.
JM Family Enterprises
Deerfield Beach-based Florida giant. Toyota/Lexus heavy.
Holman Enterprises
Family-owned group, fleet and franchise operations.
Morgan Auto Group
Florida-heavy private group with strong regional footprint.
Asbury Automotive
Public group with luxury franchise concentration.
Credit structure varies significantly. A large public dealer group (AutoNation, Penske) carries investment-grade characteristics; a single-point private dealer requires careful credit underwriting.
Key Auto Dealership Underwriting Metrics
The metrics experienced dealership investors evaluate on every site.
Site Size
5–15 acres minimum. Less than 5 acres constrains inventory and service capacity.
Frontage & Access
Highway or major arterial with signalized access. Traffic counts 25,000+ VPD.
OEM Facility Standards
Has the facility met current OEM image requirements? Pending image upgrades = landlord risk.
Tenant Credit
Corporate guarantee from a publicly traded or large private group vs. single-point franchisee without corporate backup.
Lease Remaining Term
10+ years remaining preferred for passive hold. Shorter term = value-add opportunity.
Rent-to-Revenue Ratio
Dealer rent should represent 1–3% of gross revenue. Above 3% is a stress indicator.
Redevelopment Optionality
What's the land worth without the dealership lease? Floor for downside underwriting.
Interactive Underwriting
Sample Dealership NNN Deal Pre-Loaded
Below is a representative Florida franchise dealership sale-leaseback — a $15M purchase of a Toyota/Honda dealer on a 15-year absolute NNN lease at a 7.0% cap rate.
Property Type
Property & Revenue
Financing
Hold Period & Exit
When you sell, will the market be hotter, the same, or cooler than today? This determines your exit cap rate and sale price.
Conservative — you assume the market cools and buyers pay less per dollar of income. This is the safer assumption most lenders and institutional investors use.
Overall Deal Grade
B+
IRR
9.37%
★★★★★Solid return
DSCR
1.24x
★★★★★Below lender minimum
Cash-on-Cash
5.61%
★★★★★Acceptable cash yield
Equity Multiple
2.19x
★★★★★Doubled your equity
Cash Flow Analysis
NOI vs Debt Service vs Cash Flow by year
Equity Buildup
How your equity grows: loan paydown + cash flow + appreciation
Rent Schedule
Annual NOI growth over hold period
Loan Paydown
Remaining loan balance over hold period
Income & NOI
- Year 1 EGI
- $1,050,000
- Year 1 OPEX
- $0
- Year 1 NOI
- $1,050,000
- Entrance Cap Rate
- 7.00%
- Yield on Cost
- 7.00%
- 10-Yr Total NOI
- $11,497,207
Financing
- Purchase Price
- $15,000,000
- Down Payment
- $5,250,000
- Total Equity Invested
- $5,422,500
- Loan Amount
- $9,750,000
- Monthly Payment
- $70,474
- Annual Debt Service
- $845,684
- DSCR
- 1.24x
Exit & Returns
- Exit Cap Rate
- 7.50%
- Exit Year NOI
- $1,279,944
- Exit Value
- $17,065,922
- Selling Costs (3%)
- $511,978
- Loan Payoff
- $7,720,072
- Net Sale Proceeds
- $8,833,872
- Total Profit
- $11,874,239
Save or share
Email me this underwriting summary
Get the full metrics in your inbox — forward to lenders, partners, or yourself.
Benchmark Comparison
| Metric | Your Deal | Benchmark | Status | Insight |
|---|---|---|---|---|
| IRR | 9.37% | > 12% strong | WATCH | Moderate return |
| DSCR | 1.24x | > 1.25x lender min | WATCH | Below lender minimum — refinancing risk |
| Cash-on-Cash | 5.61% | > 6% target | WATCH | Low cash yield — appreciation play |
| Equity Multiple | 2.19x | > 2.0x strong | PASS | Doubled equity or better |
| Yield on Cost vs Exit Cap | 7.00% | 7.50% exit cap | WATCH | Buying above exit cap — assumes compression |
Suggested Offer Price
What to pay for this to be a great deal — backed into from Year 1 NOI and your financing terms so the deal meets a 1.25x DSCR lender requirement on day one.
$14,899,182
Suggested Price
at 1.25x DSCR
$15,000,000
Current Asking Price
$100,818
You Save
0.7%
Discount Off Asking
Deal Metrics at Suggested Price
| Metric | At Suggested | vs Current | Status | What This Means |
|---|---|---|---|---|
| DSCR (Year 1) | 1.25x | +0.01x | PASS | Bank-ready — meets standard lender minimum |
| Entrance Cap Rate | 7.05% | +0.05% | PASS | Higher yield = more income per dollar invested |
| Year 1 Cash-on-Cash | 3.90% | +0.13% | WATCH | Modest income — grows with rent bumps |
| Down Payment | $5,214,714 | -$35,286 less | SAVINGS | $5,214,714 down + $171,845 closing = $5,386,558 total cash to close |
| Loan Amount | $9,684,468 | -$65,532 | $70,000/mo | $9,684,468 loan at 7.25% = $70,000/mo debt service |
Offer $14,899,182 (0.7% below asking) to hit 1.25x DSCR. You'd need $5,214,714 down vs $5,250,000 today — saving $35,286 in equity. Monthly payment drops from $70,474 to $70,000.
Sensitivity Matrix
Exit value at different cap rate and NOI growth combinations
| Exit Cap / Growth | 0% Growth | 1% Growth | 2% Growth | 3% Growth | 4% Growth |
|---|---|---|---|---|---|
| 6.00% | $17,500,000 | $19,330,887 | $21,332,402 | $23,518,537 | $25,904,275 |
| 6.50% | $16,153,846 | $17,843,896 | $19,691,448 | $21,709,418 | $23,911,638 |
| 7.00% | $15,000,000 | $16,569,332 | $18,284,916 | $20,158,746 | $22,203,664 |
| 7.50% | $14,000,000 | $15,464,710 | $17,065,922 | $18,814,829 | $20,723,420 |
| 8.00% | $13,125,000 | $14,498,165 | $15,999,302 | $17,638,902 | $19,428,206 |
Green = exit value exceeds purchase price. Red = exit value below purchase price.
Year-by-Year Cash Flows
Metric Glossary
IRR
Internal Rate of Return — the annualized return on every dollar you invest, accounting for timing of cash flows.
Equity Multiple
Total money returned divided by total money invested. 2.0x = you doubled your money.
Cash-on-Cash
Annual cash flow as a percentage of your invested equity. Measures what the property pays you now.
DSCR
Debt Service Coverage Ratio — how many times NOI covers the mortgage. Lenders require 1.25x minimum.
Cap Rate
NOI divided by property value. The return assuming all-cash purchase. Lower cap = higher price.
NOI
Net Operating Income — rent minus operating expenses, before mortgage payments.
Yield on Cost
Year 1 NOI divided by purchase price. The cap rate you created for yourself as a buyer.
Exit Cap
The assumed cap rate when you sell. Higher exit cap = lower sale price (conservative).
For informational and educational purposes only. Not financial or investment advice. Consult a licensed professional before making investment decisions.
Want to underwrite a different asset class? Open the full Deal Analyzer
Browse Live Retail & Business Listings
The MLS files auto dealership under its retail & business class, so this is the live inventory closest to what you're after. Tell us the specifics and we'll source the rest off-market.
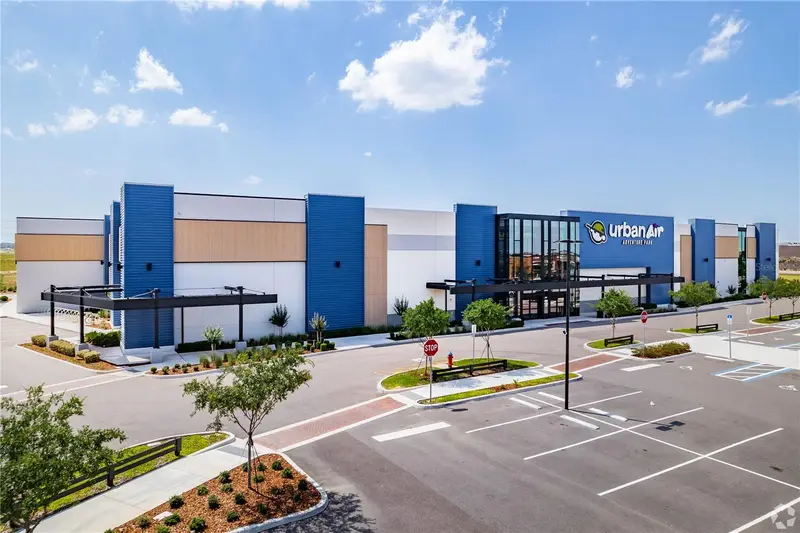
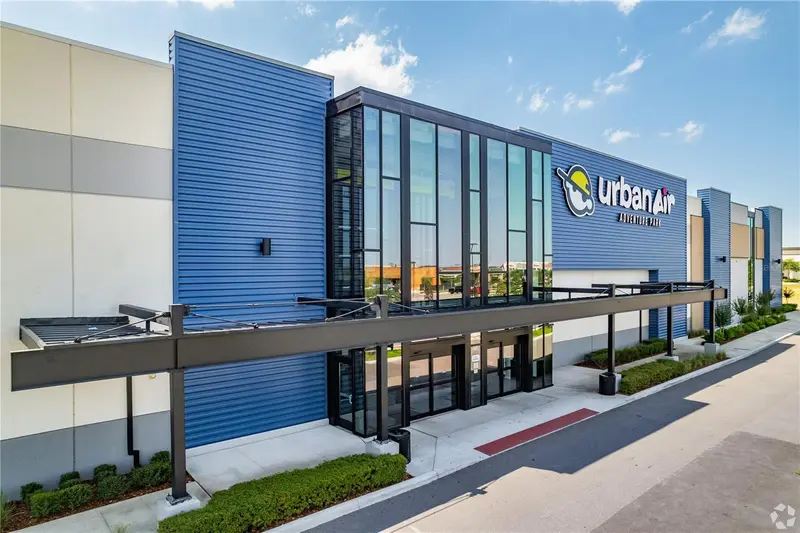

$18.90M
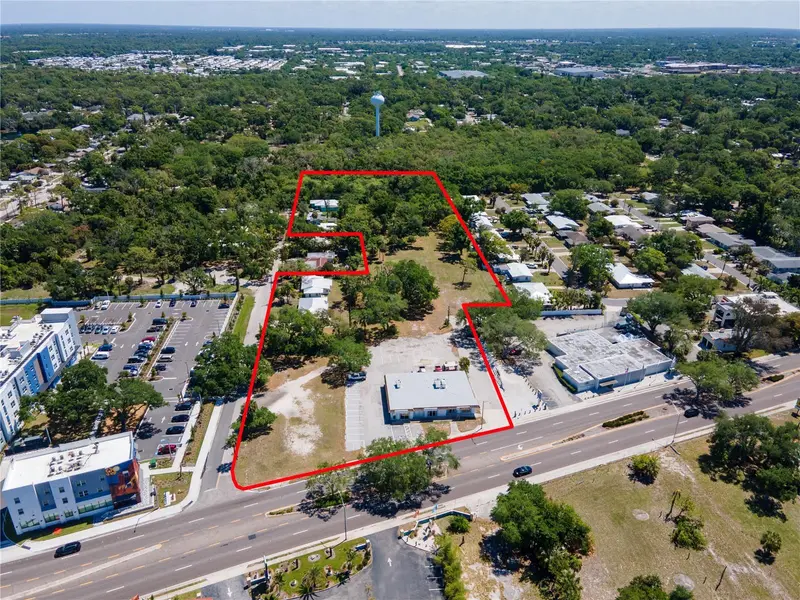
5758 Hamlin Groves Trl
Winter Garden, FL 34787
9.16 ac · Built 2023
Hamlin Southwest
MLS #O6386379, COLDWELL BANKER REALTY.
Listing provided by Stellar MLS
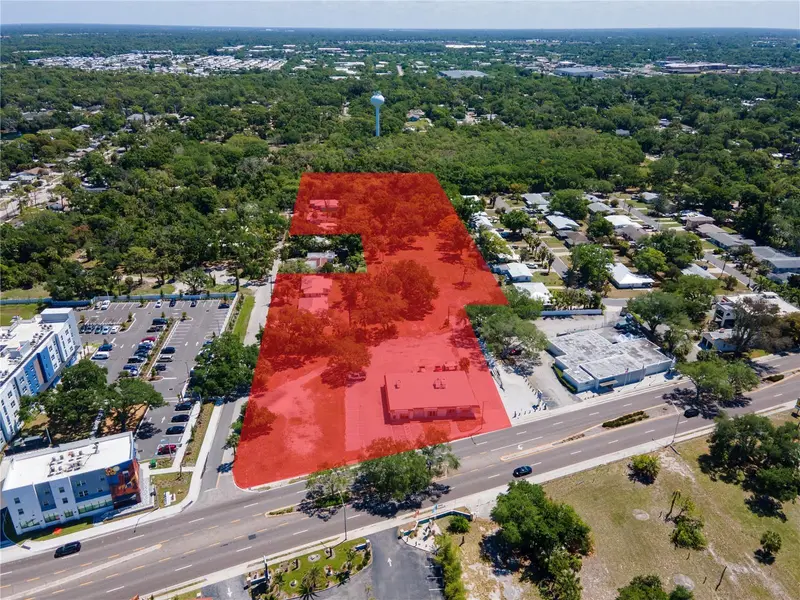
$14.00M
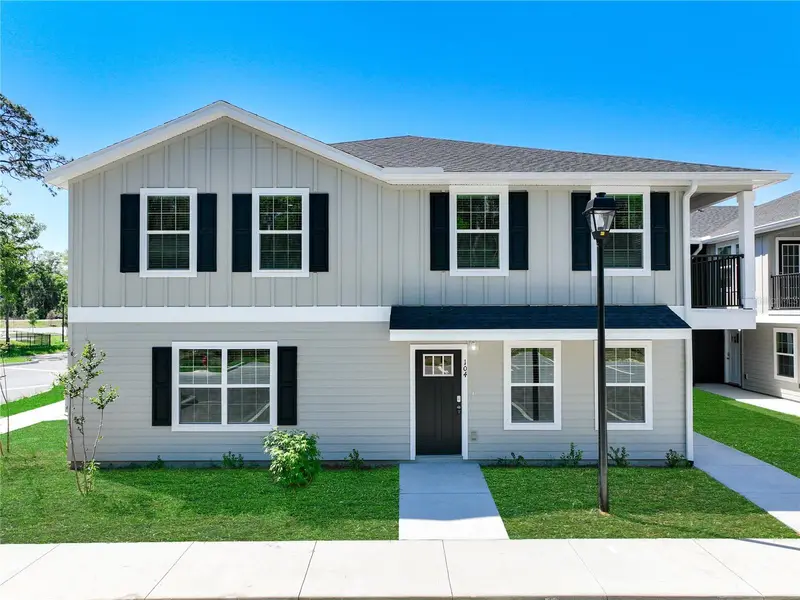
4500 N Tamiami Trl
Sarasota, FL 34234
4,714 SF · 0.55 ac · Built 1973
Phillips John Sub Rep Of
MLS #TB8489540, PEOPLE'S TRUST REALTY.
Listing provided by Stellar MLS
$12.50M
3821 Sw 43rd Ct
Ocala, FL 34474
7.07 ac · Built 2025
MLS #OM709317, SUNCOAST PROPERTY MANAGEMENT L.
Listing provided by Stellar MLS
$10.00M
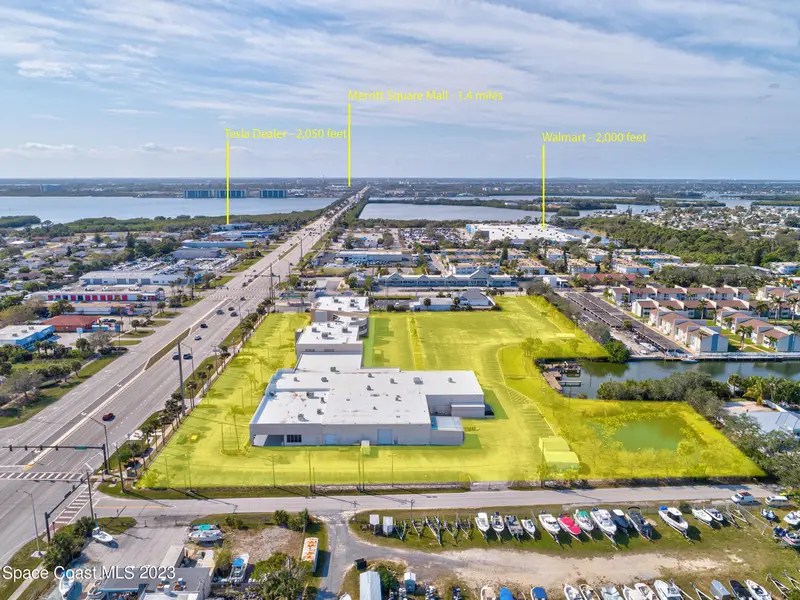
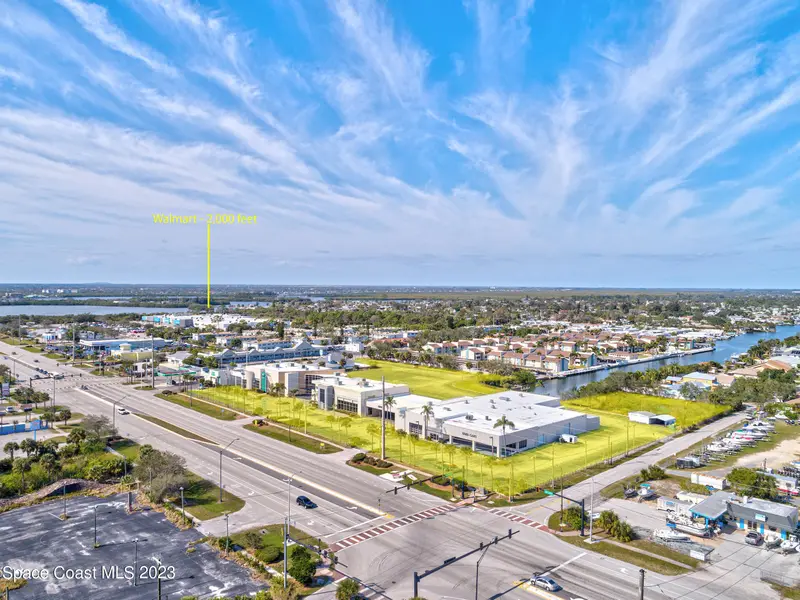
1850 E Merritt Island Causeway, Merritt Island, Fl 32952
Merritt Island, FL 32952
63,125 SF · 6.92 ac · Built 2003
MLS #975630, Perrone Realty, LLC.
Listing provided by Space Coast MLS (Space Coast Association of REALTORS®)
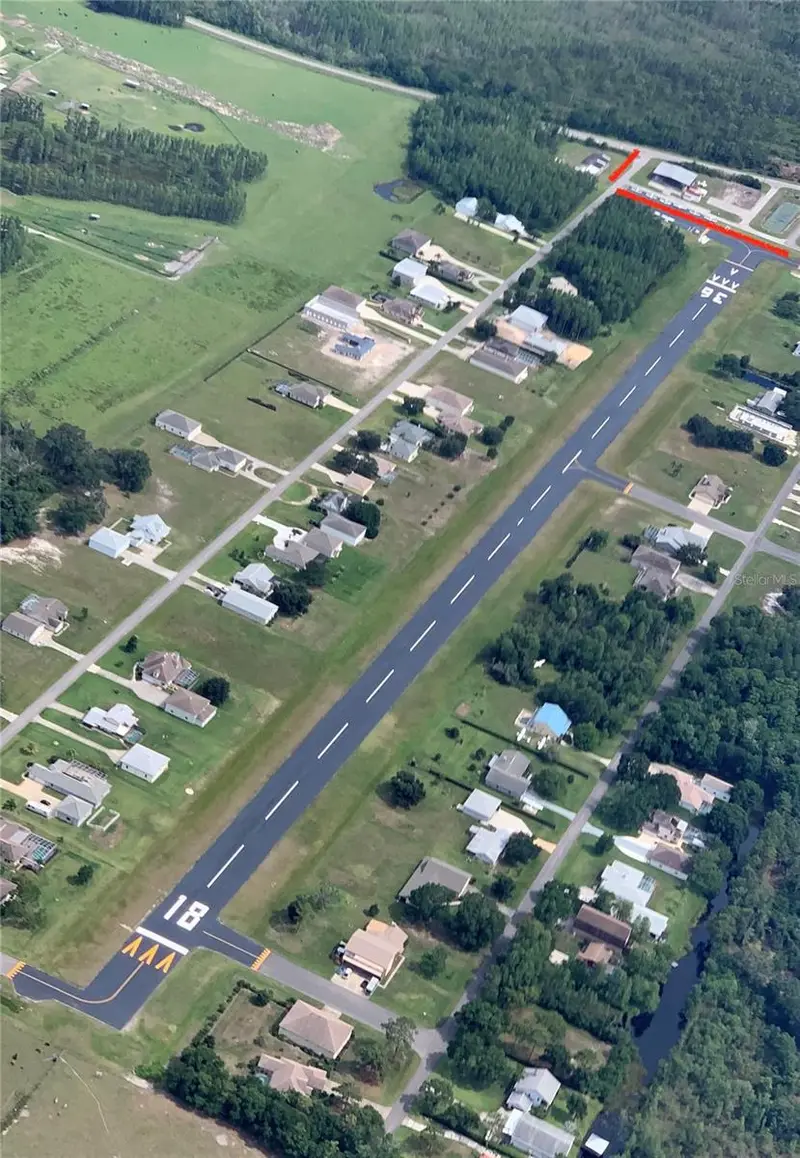

$9.90M
11500 Pilot Country Dr
Spring Hill, FL 34610
10,000 SF · 33.5 ac · Built 1998
Pilot Country Estates
MLS #TB8511456, BOB HATTON REALTY INC.
Listing provided by Stellar MLS
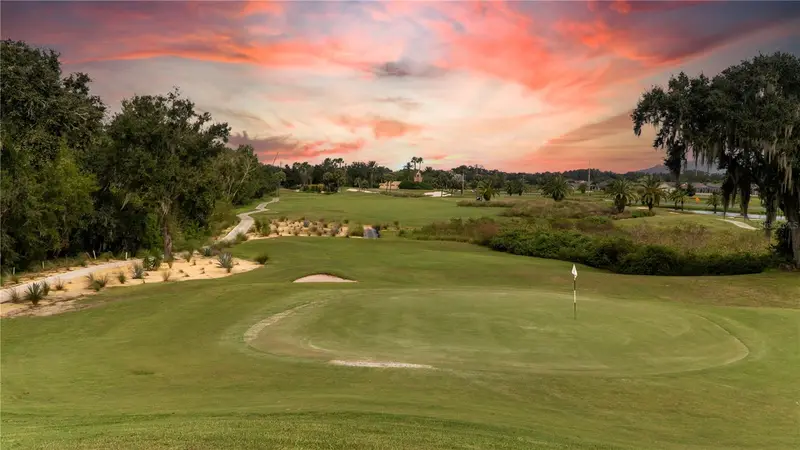
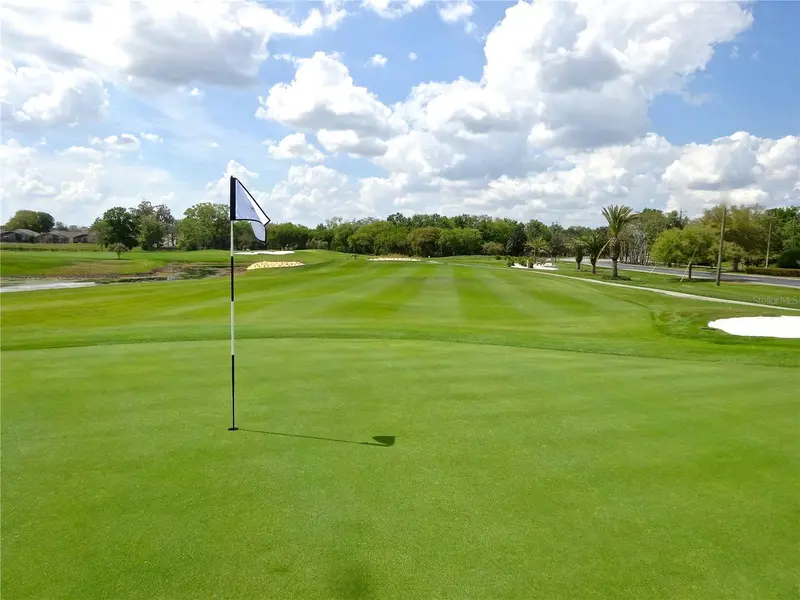
$8.72M
200 Eagle Ridge Dr
Davenport, FL 33837
3,784 SF · 202.72 ac · Built 1994
Ridgwood Lakes Village 3a
MLS #O6426961, AFFINITY REALTY LLC.
Listing provided by Stellar MLS
Listings courtesy of Stellar MLS as distributed by MLS GRID. Data deemed reliable but not guaranteed.
Browse Active Listings
Auto Dealership Deals on Major CRE Marketplaces
Active Florida auto dealership properties for sale on national CRE marketplaces.
Crexi
Tech-forward CRE marketplace
Largest growing inventory of Florida retail listings, with detailed deal rooms and OM downloads.
LoopNet
Largest CRE listings network
The biggest pool of retail listings in Florida. Search by city, county, or statewide.
CBRE Deal Flow
Institutional broker platform
CBRE's deal marketplace for institutional and mid-market retail across Florida.
Many dealership sale-leaseback transactions are executed off-market directly between dealer groups and investors. For off-market dealership NNN opportunities, tell us what you're looking for.
Frequently Asked Questions
Auto Dealership Real Estate FAQ
Common questions from investors evaluating Florida auto dealership NNN deals.
What is a typical cap rate for auto dealership properties in Florida?
Florida auto dealership properties trade in the 6.5% – 8.0% cap rate range as of 2026. Large public dealer groups (AutoNation, Lithia, Penske) on absolute NNN leases compress toward 6.5% – 7.25%. Smaller single-point franchisees or shorter remaining term deals trade 7.25% – 8.0%. The wide range reflects tenant credit, lease remaining term, OEM franchise brand, and site quality.
What is a dealership sale-leaseback?
A sale-leaseback is when a dealer group sells its real estate to an investor and simultaneously signs a long-term NNN lease to occupy the same property. The dealer monetizes the equity in its real estate (often $10M–$30M per site) while retaining operational control under the lease. The investor acquires a passive, management-free income stream.
Are auto dealerships good NNN investments?
Auto dealership NNN can be excellent investments for the right investor profile. The combination of long-duration leases, massive tenant improvement investment (OEM-required facility upgrades), large barrier-to-entry sites, and above-market cap rates relative to QSR pads or drug stores makes them compelling. The main risks are tenant credit (especially for non-corporate dealer groups) and the narrow re-leasing pool if a tenant exits.
How large are auto dealership properties?
Franchise dealership sites typically run 5–15+ acres. The facility includes a showroom/sales building (10,000 – 30,000+ SF), a service department with multiple bays (10,000 – 50,000 SF), a parts department, and an outdoor vehicle inventory lot. Large-format luxury dealers (BMW, Mercedes, Porsche) can occupy significantly larger footprints.
What happens if the dealership tenant vacates?
Dealership vacancy is uncommon on corporate NNN leases, but when it occurs the options are: (1) re-lease to another franchise dealer (requires OEM approval), (2) convert to an alternative automotive use (collision center, fleet maintenance, heavy auto service), or (3) redevelop the land for higher-and-better-use commercial. The site's highway land value typically provides a meaningful floor for underwriting.
How do I find Florida auto dealership properties for sale?
Florida dealership NNN deals trade on Crexi, LoopNet, and CoStar, but the best opportunities are often structured off-market directly between dealer groups and investors — either through broker relationships or direct outreach to dealer group finance teams. Lithia, AutoNation, and JM Family all run regular sale-leaseback programs and will engage qualified institutional buyers.
Is This You?
Quick Fit Check
If you nod "yes" to three or more of these, Florida retail deserves a slot on your shortlist.
You want a broad spectrum of passive, management-light investment options.
You value long lease terms from corporate-credit or investment-grade tenants.
You need the bonus depreciation and cost segregation benefits of fee-simple real estate.
You're on a 1031 exchange clock and need a fast-closing NNN deal.
You want exposure to Florida's population growth and retirement demographics.
See Available Auto Dealership Properties
Tell us about your retail investment criteria and we will send you current Florida opportunities — on and off market.
Related Resources
NNN Properties Florida
Every triple net lease format trading in Central Florida.
Learn more →Orlando Cap Rates Investor Guide
Current cap rate trends by property type across the Orlando MSA.
Learn more →Car Wash Properties Florida
Deep dive on one of the fastest-consolidating retail-adjacent asset classes.
Learn more →