
Grocery-Anchored Retail Investment
Grocery-Anchored Retail in Florida
The most resilient multi-tenant retail format in the country — anchored by daily-needs traffic that compounds for decades
Grocery-anchored retail is the institutional gold standard for Florida multi-tenant investors. A Publix, ALDI, or Whole Foods anchor drives 40,000+ weekly visits, locks shop tenants into long-term leases, and creates a daily-needs traffic moat that e-commerce and recessions can’t dent. With Florida’s population growing at 1,200+ residents per day and Publix headquartered in Lakeland, no market on earth produces more grocery-anchored deal flow. Cap rates run 6.0%–7.5% depending on anchor credit, tenant mix, and location.
Typical Deal Size
$6M – $40M
Neighborhood strips to Publix-anchored community centers
Common Cap Rate
6.0% – 7.5%
Publix-anchored tightest, regional/value-add widest
Weekly Visits (Publix)
40,000+
Per store — the traffic engine behind shop-tenant rents
Grocery-Anchored Center Formats
Not all grocery-anchored product is the same. Here are the six most actively traded formats in Florida and what investors should expect from each.
Publix-Anchored Neighborhood Center
The institutional gold standard in Florida retail. Publix drives 40,000+ weekly visits and supports shop-tenant rents of $22–$35 PSF. Corporate lease with 5% bumps every 5 years.
ALDI / Sprouts-Anchored Center
Discount and specialty grocers anchor value-oriented neighborhood centers. ALDI's low-overhead model produces strong unit economics and high renewal probability.
Winn-Dixie / Southeastern Grocers Center
Regional grocer-anchored centers offer higher yields than Publix product with comparable footfall. Credit underwriting is the key variable.
Shadow-Anchored Strip
Multi-tenant strip adjacent to a grocery anchor that benefits from spillover traffic without owning the anchor building. Highest cap rate in the grocery-adjacent category.
Community Center (Grocery + Junior Anchors)
Grocery anchor plus one or more junior boxes (Ross, HomeGoods, PetSmart) and 20–40 shop tenants. Institutional-scale centers trade to fund buyers and family offices.
Single-Tenant Grocery NNN
Freestanding Publix, Whole Foods, or Trader Joe's on a long-term absolute NNN. Rare and tightly held — one of the most sought-after single-tenant categories in the country.
Why Florida Is the Best Grocery-Anchored Market in America
Population growth, the Publix home-court advantage, retiree demographics, and no state income tax combine to give Florida grocery-anchored retail the deepest demand and most liquid transaction market in the country.
Publix's Home Market
Publix Super Markets, headquartered in Lakeland, FL, is the single most powerful grocery anchor in the country. Florida has more Publix stores than any other state — 800+ locations — and investors pay a premium to own the real estate.
1,200+ New Residents Per Day
Florida adds more than 1,200 net new residents every day. Every new rooftop requires daily-needs services — and grocery is the first tenant category to follow population growth.
Retiree Demographics
Florida's 65+ population — the highest share of any state — shops for groceries daily rather than weekly. Grocery stores in retirement corridors post some of the strongest sales-per-SF in the country.
Tourism Drives Supplemental Volume
130M+ annual visitors shop at Florida grocery stores, convenience stores, and neighborhood centers near theme parks, beaches, and resort corridors — layering tourist demand on top of resident traffic.
No Income Tax = Disposable Income
Florida's income-tax-free environment attracts high-earning households who spend more per grocery trip. Premium grocery formats (Whole Foods, Sprouts, Trader Joe's) perform better in Florida than comparable markets elsewhere.
E-Commerce Resistant
Grocery remains the most e-commerce resistant category in retail. Fresh produce, deli, bakery, and pharmacy services are high-frequency, immediate-need purchases that online delivery cannot fully replicate.
Grocery-Anchored Retail: Pros & Cons
An honest look at both sides so you can determine if this asset class fits your investment strategy.
Why Buy
The Most Durable Anchor in Retail
Grocery-anchored centers have outperformed every retail format through every downturn since 1990. Daily-needs foot traffic is the most resilient demand driver in commercial real estate.
Deep Institutional Liquidity
Grocery-anchored product is the most sought-after multi-tenant retail category by institutional buyers. Strong exit market from REITs, pension funds, and family offices keeps cap rate compression intact.
Shop Tenant Stability
Anchor-driven foot traffic reduces shop tenant rollover risk and supports higher rents. Grocery-anchored centers consistently post vacancy rates 200–400 bps below unanchored strips.
Diversified Income Stream
Multi-tenant rent roll diversifies income across 10–40 tenants. No single shop tenant typically exceeds 10–15% of gross rent — far safer than single-tenant NNN.
Long-Duration Anchor Leases
Publix and major grocery anchors sign 20–25 year initial terms and almost always renew — their $3M–$10M store buildout investment creates massive moving costs.
Inflation-Protected Rents
Shop-tenant leases typically include annual CPI bumps or fixed 3% steps. Combined with below-market anchor rents, centers have significant mark-to-market upside over time.
What to Watch
Anchor Renewal Risk
When an anchor closes or fails to renew, co-tenancy clauses allow shop tenants to reduce rent or terminate. Stress-test anchor dark scenarios and underwrite re-leasing reserve carefully.
Active Management Required
Multi-tenant centers require a property manager, CAM reconciliation, and ongoing leasing activity — not passive mailbox money like a single-tenant NNN.
TI and Leasing Commissions
Shop-space rollover typically triggers landlord TI ($20–$50 PSF) and leasing commissions (4–6% of total rent). Budget reserves at 3–5% of NOI annually.
Larger Minimum Investment
Quality grocery-anchored centers start at $6M–$8M and institutional Publix centers trade well above $15M — a higher capital threshold than single-tenant NNN pads.
Environmental Exposure
Grocery stores generate waste, refrigerant, and cleaning-chemical usage. Always run a Phase I ESA — older centers may have legacy underground storage tank issues.
Who Grocery-Anchored Centers Are Best Suited For
Grocery-anchored retail serves a different investor profile than single-tenant NNN. Here are the five buyer types who consistently compete for Florida grocery-anchored product.
1031 Exchange Buyers
Deadline-Driven
Investors rolling out of apartment buildings, industrial properties, or land with $3M–$10M+ of proceeds and a 180-day clock.
Why It Fits
Grocery-anchored centers offer diversified income, institutional-quality tenancy, and close timelines that fit 1031 deadlines.
Family Offices & Trusts
Long Duration
Allocators with 20–30-year hold horizons seeking predictable income from assets with hard-to-replicate competitive positions.
Why It Fits
Grocery anchors create traffic moats that compound over decades. Few assets have longer institutional hold periods.
REIT & Institutional Funds
Scale Allocators
Public and private REITs building diversified grocery-anchored portfolios across Sunbelt growth markets.
Why It Fits
Florida's population velocity and Publix dominance make it a mandatory allocation for grocery-anchored REITs.
Value-Add Operators
Force Appreciation
Sponsors who acquire below-market-rent centers, cure deferred maintenance, re-tenant vacant shop space, and sell stabilized.
Why It Fits
Grocery-anchored centers with 10–20% vacancy or below-market shop rents offer the best risk-adjusted value-add in retail.
High-Net-Worth Passive Investors
Income + Growth
Accredited investors seeking yield above fixed income with inflation-protection from real asset ownership.
Why It Fits
Grocery-anchored returns blend anchor stability with shop-tenant upside — a balanced profile for income-focused portfolios.
Every Florida Grocery Chain, Ranked
Anchor brand determines cap rate more than almost any other variable. Below is every major grocery operator in Florida ranked by store count — with ownership, credit, format, and our CRE anchor-desirability tier. Note the gap between raw store count and anchor value: Publix has the most stores and the tightest caps, but a discount banner with 300 stores does not anchor like a Whole Foods with 38.
Tightest caps (6.0%–6.5%)
Publix-anchored. The single most cap-compressing anchor in Florida retail. Deepest institutional and 1031 buyer demand.
6.25%–7.0%
Whole Foods, Sprouts, Trader Joe's, The Fresh Market. Affluent-demographic specialty grocers with strong shop-tenant draw and (often) investment-grade credit.
Own real estate / shadow anchor
Walmart, Target, ALDI. Investment-grade credit, but the big-box players usually own or ground-lease their box — they boost a center as a shadow anchor more than an in-line lease.
6.75%–8.0%
Winn-Dixie, Sedano's, Presidente, Bravo, Fresco y Más. Regional and Hispanic banners with strong in-trade-area performance; underwrite the operator's guaranty carefully.
7.5%–9.0%+
Save A Lot, Key Food, independents. Higher yield to compensate for operator-level credit and thinner guaranties. Site quality and sales history matter most here.
| # | Grocery Chain | FL Stores | Ownership / Credit | Format | Anchor Tier |
|---|---|---|---|---|---|
| 1 | Publix Super Markets The undisputed #1 grocery anchor in America. ~35% North FL market share, profitable every quarter since 1959, 40k+ weekly visits/store. Compresses center cap rates 75–150 bps versus a generic anchor. | 917 | Employee-owned (private) | Conventional · 28k–61k SF | Trophy |
| 2 | Walmart (all formats) ~390 FL retail units. Investment-grade credit, but Walmart usually owns its real estate or ground-leases — rarely the in-line anchor of a third-party multi-tenant center. ~27% FL market share. | ~390 | Walmart Inc. · NYSE: WMT (A / investment grade) | Supercenter + Neighborhood Market | Institutional |
| 3 | Winn-Dixie Florida's #2 conventional grocer by count. ALDI's 2024 acquisition of Southeastern Grocers upgraded the credit story; some stores are being converted to ALDI banners. ~17% FL market share. | 327 | Southeastern Grocers → ALDI-owned | Conventional regional · 35k–55k SF | Regional |
| 4 | ALDI Fastest-growing grocer in Florida. Lean small-box model, very high renewal probability, and a corporate guarantee behind every lease. Now controls Winn-Dixie/Fresco y Más — ~19% combined FL share. | 315 | ALDI Süd (private, German) | Discount · 18k–22k SF | Institutional |
| 5 | Target (grocery format) Expanded grocery sections drive grocery-comparable weekly visits. Like Walmart, typically owns its box — counts as a shadow anchor more often than an in-line tenant. | 125 | Target Corp · NYSE: TGT (investment grade) | General merch + grocery | Institutional |
| 6 | Key Food Cooperative banner concentrated in dense and urban-infill trade areas. Credit sits at the individual-operator level, so underwrite the specific member's guaranty. | 104 | Cooperative (member-owned) | Conventional / urban · 15k–40k SF | Value |
| 7 | Tom Thumb Florida-based convenience/fuel chain (distinct from the Texas grocery banner). Functions as a c-store pad rather than a true grocery anchor. | 103 | Private (FL convenience operator) | Convenience + fuel | Value |
| 8 | Save A Lot Deep-discount small box serving value-oriented trade areas. Mix of corporate and licensed-operator stores — guaranty quality varies widely. | 68 | Private (Moran Foods) | Discount · 15k–20k SF | Value |
| 9 | Sprouts Farmers Market Health-focused grocer on a national growth program. Targets $75k+ HHI corridors and master-planned communities. Strong shop-tenant draw; tightens caps in affluent submarkets. | 63 | Sprouts · NASDAQ: SFM | Specialty / health · 23k–30k SF | Premium |
| 10 | The Fresh Market Florida is its single largest state (~30% of all locations). Upscale, experiential format that performs in high-income and tourist-adjacent trade areas. | 52 | Cencosud-owned (private) | Premium specialty · 18k–25k SF | Premium |
| 11 | Bravo Supermarkets Hispanic-format grocer with deep loyalty and high sales-per-SF in Latino trade areas. Operator-level credit; strong in-trade-area performance offsets thinner guaranties. | 50 | Private (Hispanic banner) | Hispanic conventional | Regional |
| 12 | Presidente Supermarkets One of the largest Hispanic-owned grocers in the US. Concentrated in Miami-Dade, Broward, Palm Beach, and Orlando. Dominant cultural anchor in its trade areas. | 44 | Private (Cuban-American family) | Hispanic conventional | Regional |
| 13 | Whole Foods Market Amazon credit behind every lease. Targets the most affluent Florida submarkets. Freestanding Whole Foods NNN trades at some of the tightest grocery cap rates in the state. | 38 | Amazon · NASDAQ: AMZN (investment grade) | Premium / organic · 30k–45k SF | Premium |
| 14 | Sedano's Supermarkets South Florida institution centered on Miami-Dade. Extremely high cultural loyalty produces grocery-leading sales-per-SF in its core trade areas. | ~34 | Private (largest Hispanic-owned US grocer) | Hispanic conventional | Regional |
| 15 | Trader Joe's Cult-loyalty specialty grocer. Rarely the anchor of a conventional center — usually freestanding or an in-line tenant in lifestyle centers — but a powerful co-tenancy and traffic magnet. | ~30 | Aldi Nord-owned (private) | Specialty · 12k–15k SF | Premium |
| 16 | Fresco y Más Hispanic-value banner from the Southeastern Grocers / ALDI family. Targets value-oriented Latino trade areas across South and Central Florida. | 25 | Southeastern Grocers → ALDI-owned | Hispanic value | Regional |
Florida store counts are approximate as of 2026 and shift with each quarter’s openings and banner conversions. Market-share figures reflect the North Florida region. Anchor tiers reflect MaxLife’s view of CRE cap-rate impact, not tenant quality in absolute terms.
Warehouse Clubs
Powerful traffic drivers, but they almost always own or ground-lease their box — so they show up as shadow anchors next to a center rather than as in-line grocery anchors.
Notable Independents & Regionals
Small-footprint banners that dominate specific Florida trade areas. They can be excellent anchors locally, but credit lives at the operator level — underwrite the guaranty and the sales history.
Anchor brand is a starting point — always underwrite the specific lease, remaining term, co-tenancy exposure, and store-level sales data before closing.
Key Grocery-Anchored Underwriting Metrics
The numbers experienced grocery-anchored investors stress-test on every deal. Use these as benchmarks when reviewing an offering memorandum or rent roll.
Anchor Rent PSF
Publix pays $9–$14 PSF NNN in Florida — deliberately below market to secure long terms. Mark-to-market upside is significant at rollover.
Shop Tenant Rents
$22–$35 PSF NNN for inline shop space. End-caps and drive-thru pads command 30–50% premiums.
Occupancy Cost Ratio
Shop-tenant rent / sales should be under 10–12%. Anchor occupancy cost is typically 1–3% of sales — one reason they almost always renew.
Traffic Counts
Target 15,000+ VPD on the fronting road. 25,000+ VPD for quality Publix-anchored centers. Lower traffic requires deeper demographic underwriting.
3-Mile Trade Area Population
30,000+ population supports a neighborhood center. 60,000+ for a community center with multiple anchors.
Median Household Income
$55,000+ HHI within 3 miles for conventional grocery. Premium grocery (Whole Foods, Sprouts) needs $75,000+.
Lease Rollover Schedule
No more than 20% of GLA rolling in any 12-month window. Ladder expirations to reduce lease concentration risk.
Co-Tenancy Clause Exposure
Map all co-tenancy clauses to anchor status. A dark anchor can trigger 30–50% rent abatements across the shop-tenant roll.
Interactive Underwriting
Sample Publix-Anchored Center Pre-Loaded
Below is a representative Central Florida Publix-anchored neighborhood center already loaded into our deal analyzer — an $11.5M purchase at a 6.75% cap with 78,000 SF GLA and 5% vacancy. Adjust any assumption to stress-test returns, DSCR, IRR, and equity multiple in real time.
Property Type
Property & Revenue
Financing
Hold Period & Exit
When you sell, will the market be hotter, the same, or cooler than today? This determines your exit cap rate and sale price.
Conservative — you assume the market cools and buyers pay less per dollar of income. This is the safer assumption most lenders and institutional investors use.
Overall Deal Grade
B
IRR
9.15%
★★★★★Solid return
DSCR
1.06x
★★★★★Negative cash flow risk
Cash-on-Cash
3.57%
★★★★★Low cash yield
Equity Multiple
2.27x
★★★★★Doubled your equity
Cash Flow Analysis
NOI vs Debt Service vs Cash Flow by year
Equity Buildup
How your equity grows: loan paydown + cash flow + appreciation
Rent Schedule
Annual NOI growth over hold period
Loan Paydown
Remaining loan balance over hold period
Income & NOI
- Year 1 EGI
- $737,438
- Year 1 OPEX
- $0
- Year 1 NOI
- $737,438
- Entrance Cap Rate
- 6.41%
- Yield on Cost
- 6.41%
- 10-Yr Total NOI
- $8,261,794
Financing
- Purchase Price
- $11,500,000
- Down Payment
- $3,450,000
- Total Equity Invested
- $3,585,500
- Loan Amount
- $8,050,000
- Monthly Payment
- $58,186
- Annual Debt Service
- $698,231
- DSCR
- 1.06x
Exit & Returns
- Exit Cap Rate
- 6.91%
- Exit Year NOI
- $943,982
- Exit Value
- $13,656,164
- Selling Costs (3%)
- $409,685
- Loan Payoff
- $6,374,008
- Net Sale Proceeds
- $6,872,471
- Total Profit
- $8,151,951
Save or share
Email me this underwriting summary
Get the full metrics in your inbox — forward to lenders, partners, or yourself.
Benchmark Comparison
| Metric | Your Deal | Benchmark | Status | Insight |
|---|---|---|---|---|
| IRR | 9.15% | > 12% strong | WATCH | Moderate return |
| DSCR | 1.06x | > 1.25x lender min | FAIL | Below lender minimum — refinancing risk |
| Cash-on-Cash | 3.57% | > 6% target | WATCH | Low cash yield — appreciation play |
| Equity Multiple | 2.27x | > 2.0x strong | PASS | Doubled equity or better |
| Yield on Cost vs Exit Cap | 6.41% | 6.91% exit cap | WATCH | Buying above exit cap — assumes compression |
Suggested Offer Price
What to pay for this to be a great deal — backed into from Year 1 NOI and your financing terms so the deal meets a 1.25x DSCR lender requirement on day one.
$9,716,585
Suggested Price
at 1.25x DSCR
$11,500,000
Current Asking Price
$1,783,415
You Save
15.5%
Discount Off Asking
Deal Metrics at Suggested Price
| Metric | At Suggested | vs Current | Status | What This Means |
|---|---|---|---|---|
| DSCR (Year 1) | 1.25x | +0.19x | PASS | Bank-ready — meets standard lender minimum |
| Entrance Cap Rate | 7.59% | +1.18% | PASS | Higher yield = more income per dollar invested |
| Year 1 Cash-on-Cash | 4.85% | +3.76% | WATCH | Modest income — grows with rent bumps |
| Down Payment | $2,914,975 | -$535,025 less | SAVINGS | $2,914,975 down + $123,016 closing = $3,037,992 total cash to close |
| Loan Amount | $6,801,609 | -$1,248,391 | $49,162/mo | $6,801,609 loan at 7.25% = $49,162/mo debt service |
Offer $9,716,585 (15.5% below asking) to hit 1.25x DSCR. You'd need $2,914,975 down vs $3,450,000 today — saving $535,025 in equity. Monthly payment drops from $58,186 to $49,162.
Sensitivity Matrix
Exit value at different cap rate and NOI growth combinations
| Exit Cap / Growth | 0% Growth | 1% Growth | 2% Growth | 3% Growth | 4% Growth |
|---|---|---|---|---|---|
| 5.41% | $13,624,711 | $15,050,158 | $16,608,447 | $18,310,473 | $20,167,901 |
| 5.91% | $12,472,516 | $13,777,417 | $15,203,927 | $16,762,018 | $18,462,370 |
| 6.41% | $11,500,000 | $12,703,154 | $14,018,436 | $15,455,038 | $17,022,809 |
| 6.91% | $10,668,174 | $11,784,301 | $13,004,444 | $14,337,133 | $15,791,503 |
| 7.41% | $9,948,567 | $10,989,407 | $12,127,247 | $13,370,042 | $14,726,309 |
Green = exit value exceeds purchase price. Red = exit value below purchase price.
Year-by-Year Cash Flows
Metric Glossary
IRR
Internal Rate of Return — the annualized return on every dollar you invest, accounting for timing of cash flows.
Equity Multiple
Total money returned divided by total money invested. 2.0x = you doubled your money.
Cash-on-Cash
Annual cash flow as a percentage of your invested equity. Measures what the property pays you now.
DSCR
Debt Service Coverage Ratio — how many times NOI covers the mortgage. Lenders require 1.25x minimum.
Cap Rate
NOI divided by property value. The return assuming all-cash purchase. Lower cap = higher price.
NOI
Net Operating Income — rent minus operating expenses, before mortgage payments.
Yield on Cost
Year 1 NOI divided by purchase price. The cap rate you created for yourself as a buyer.
Exit Cap
The assumed cap rate when you sell. Higher exit cap = lower sale price (conservative).
For informational and educational purposes only. Not financial or investment advice. Consult a licensed professional before making investment decisions.
Want to underwrite a different asset class? Open the full Deal Analyzer
Live Retail & Shopping Center Listings
Live Stellar MLS inventory — straight from MaxLife, no third-party portal.
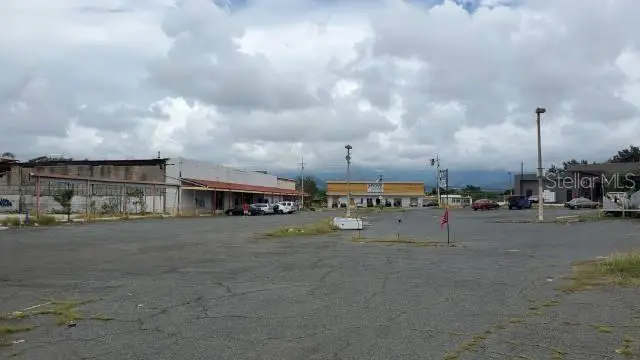
$15.00M
5510 W Colonial Dr
Orlando, FL 32808
37,291 SF · 4.24 ac · Built 1978
MLS #O6357931, AFFINITY REALTY LLC.
Listing provided by Stellar MLS
$14.00M
4500 N Tamiami Trl
Sarasota, FL 34234
4,714 SF · 0.55 ac · Built 1973
Phillips John Sub Rep Of
MLS #TB8489540, PEOPLE'S TRUST REALTY.
Listing provided by Stellar MLS
$10.50M
Pr-116 Int. Pr-121
Yauco, PR 00698
4.64 ac · Built 1990
Yauco Shopping Center
MLS #PR9097539, WINER PROPERTY GROUP.
Listing provided by Stellar MLS
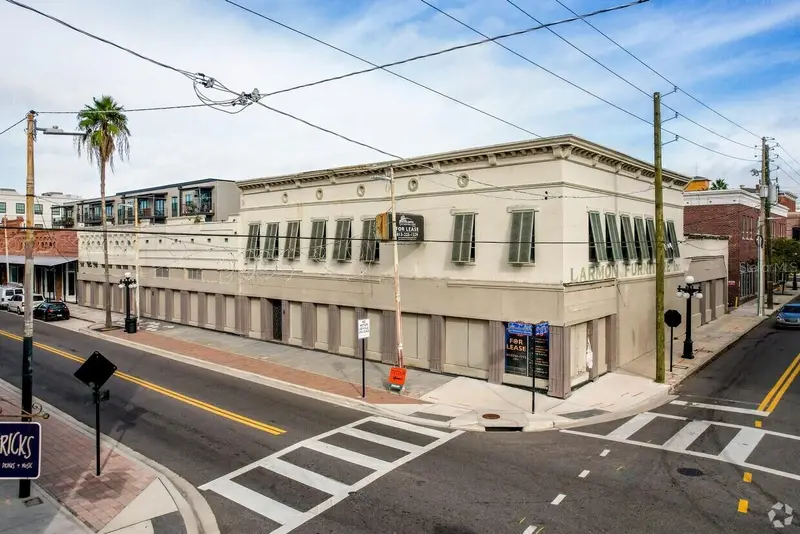
$9.99M
1324 E 7th Ave
Tampa, FL 33605
21,555 SF · 0.35 ac · Built 1905
Ybor City Blk Y
MLS #TB8491237, FLORIDA COMMERCIAL GROUP.
Listing provided by Stellar MLS
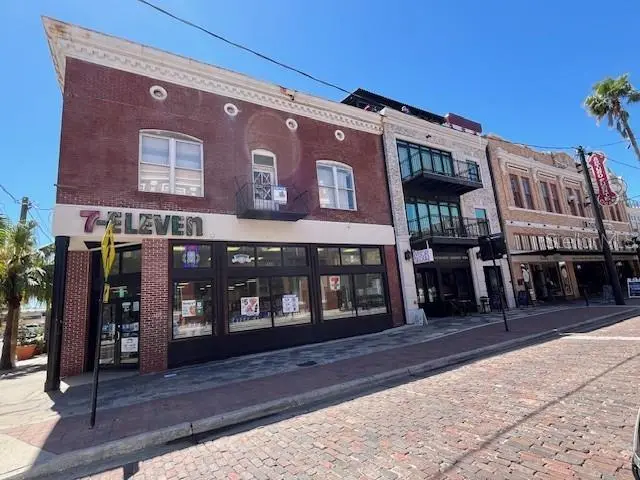
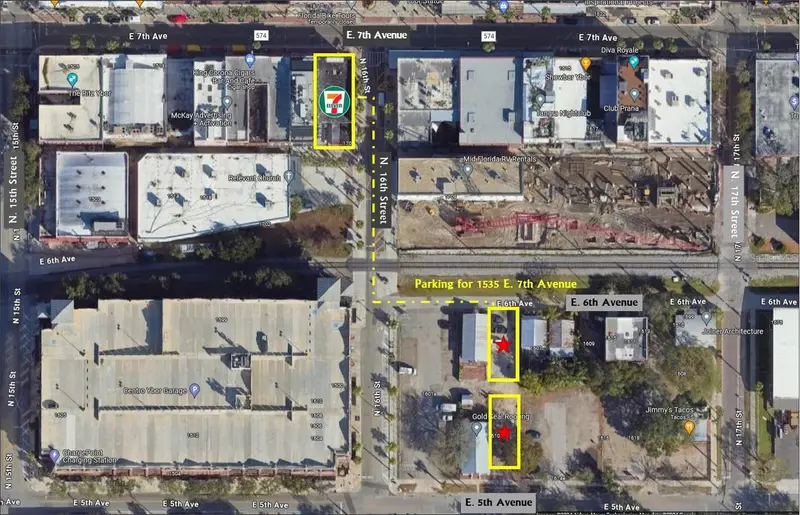
$6.95M
1535 E 7th Ave
Tampa, FL 33605
7,114 SF · 0.09 ac · Built 1908
Ybor City Blk Y
MLS #T3401081, FLORIDA COMMERCIAL GROUP.
Listing provided by Stellar MLS
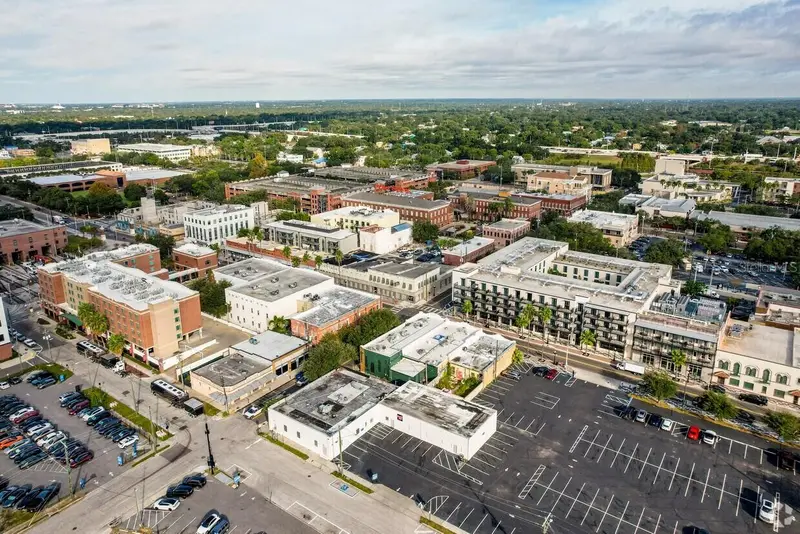
$6.60M
418 N Dale Mabry Hwy
Tampa, FL 33609
13,000 SF · 0.68 ac · Built 1987
Broadmoor Park Rev
MLS #TB8515732, SOUTH CEDAR REAL ESTATE, INC.
Listing provided by Stellar MLS
Listings courtesy of Stellar MLS as distributed by MLS GRID. Data deemed reliable but not guaranteed.
Browse Active Listings
Grocery-Anchored Deals on Major CRE Marketplaces
Want to see what’s publicly listed right now? These marketplaces aggregate on-market grocery-anchored opportunities across Florida.
Crexi
Tech-forward CRE marketplace
Growing inventory of grocery-anchored and multi-tenant retail listings across every Florida market, with detailed deal rooms and OM downloads.
LoopNet
Largest CRE listings network
The biggest pool of grocery-anchored and neighborhood center listings in Florida. Search by city, county, or statewide.
CoStar
Institutional research platform
The data layer behind most Florida grocery-anchored transactions. Best for rent comps, occupancy trends, and anchor sales history.
The best grocery-anchored deals in Florida rarely hit public marketplaces. Publix-anchored centers in particular trade between institutions and family offices before ever being listed. For off-market opportunities, tell us what you’re looking for.
Frequently Asked Questions
Grocery-Anchored Retail Investor FAQ
The questions we get most often from investors evaluating their first Florida grocery-anchored center.
What cap rates do grocery-anchored centers trade at in Florida in 2026?
Publix-anchored neighborhood centers are trading in the 6.0%–7.0% cap rate range in Central Florida as of 2026. Premium assets in high-growth submarkets (Lake Nona, Winter Garden, Lakewood Ranch) compress toward 6.0%–6.5%. Regional grocery anchors (Winn-Dixie, ALDI) trade 50–100 bps wider. Freestanding single-tenant Publix NNN can trade sub-6.0%.
What are the biggest grocery chains in Florida?
By store count in 2026, the largest grocery chains in Florida are: (1) Publix — ~917 stores, (2) Walmart — ~390 retail units across all formats, (3) Winn-Dixie — 327, (4) ALDI — 315, (5) Target — 125, (6) Key Food — 104, (7) Tom Thumb — 103, (8) Save A Lot — 68, (9) Sprouts — 63, and (10) The Fresh Market — 52. Hispanic banners like Bravo (50), Presidente (44), and Sedano's (~34) round out the top tier, along with Whole Foods (38) and Trader Joe's (~30). Publix alone holds roughly 35% of the North Florida grocery market. Note that ALDI's 2024 acquisition of Southeastern Grocers — parent of Winn-Dixie and Fresco y Más — gives the ALDI family a combined ~19% Florida share.
Which grocery anchors compress cap rates the most?
Publix is in a tier of its own — a Publix-anchored center trades 75–150 bps tighter than a center with a generic or regional anchor, often into the low 6% range. The next tier is premium specialty grocers — Whole Foods (Amazon credit), Sprouts, Trader Joe's, and The Fresh Market — which draw affluent demographics and strong shop tenants. Investment-grade big-box players like Walmart and Target carry excellent credit but usually own their real estate, so they help a center as shadow anchors rather than in-line leases. Regional and Hispanic banners (Winn-Dixie, Sedano's, Presidente, Bravo) and value/discount banners (Save A Lot, Key Food) trade progressively wider to compensate for operator-level credit.
Why do investors pay a premium for Publix-anchored centers?
Publix is the undisputed grocery king of Florida — employee-owned, profitable every quarter since 1959, and with 800+ Florida stores that generate some of the highest sales-per-SF in the country. Publix anchors drive 40,000+ weekly visits, produce some of the lowest dark-store risk in retail, and create tenant demand from shops that want to be in the traffic stream. Institutions pay premium cap rates because Publix reduces risk structurally, not just cosmetically.
What happens when a grocery anchor goes dark?
A dark anchor triggers co-tenancy clauses in most shop-tenant leases — typically allowing tenants to reduce rent to percentage-of-sales-only (usually 2–5%) or terminate with 60–90 days' notice. Underwriting a potential dark scenario means (1) mapping all co-tenancy clauses, (2) calculating NOI impact if 30–60% of shop tenants exercise abatement rights, and (3) reserving for re-leasing TI to re-anchor the center.
Is a grocery-anchored center better than a single-tenant NNN?
Different risk profiles, not better or worse. Single-tenant NNN gives you simplicity — one lease, one tenant, zero management. Grocery-anchored gives you diversification across 10–40 tenants, upside from below-market shop rents, and a traffic-generating anchor that de-risks rollover. NNN is for passive income maximizers; grocery-anchored is for investors who want income + appreciation + portfolio durability.
Can I 1031 exchange into a grocery-anchored center?
Yes. Grocery-anchored centers are like-kind replacement property for 1031 exchanges. Institutional-quality Publix centers can close in 45–75 days, comfortably inside the 180-day deadline. For investors with $2M–$6M in exchange proceeds, partial interests via DST structures offer access to institutional grocery-anchored product at smaller equity minimums.
What is a shadow-anchored center?
A shadow-anchored center is a multi-tenant retail strip located adjacent to a grocery anchor — but in a separate ownership parcel. The strip benefits from the anchor's foot traffic without being part of the same ownership structure. These trade at 75–150 bps wider cap rates than grocery-anchored centers because they lack the formal co-tenancy protections and anchor-relationship controls.
How do I underwrite the shop-tenant rent roll?
Key metrics: (1) weighted average lease term remaining — prefer 3+ years WALT on shop space, (2) occupancy cost ratio per tenant — flag anyone above 12%, (3) expiration ladder — no more than 20% rolling in any year, (4) sales-reporting tenants — validate rents against reported sales where available, (5) renewal probability by tenant category — fitness and medical renew at much higher rates than apparel or home goods.
What submarkets have the best grocery-anchored deals in Florida?
Central Florida's fastest-growing corridors are producing the most grocery-anchored transaction volume: Lake Nona, Winter Garden, Horizon West, Saint Cloud, and Apopka on the Orlando side; Wesley Chapel, Riverview, and Lakeland in the I-4 corridor; Palm Bay and Viera on the Space Coast. These submarkets combine population in-migration, below-average vacancy, and Publix's active expansion pipeline.
Is This You?
Quick Fit Check
If you nod “yes” to three or more of these, grocery-anchored retail likely deserves a slot on your shortlist.
You want diversified multi-tenant income from a recession-resilient asset.
You're comfortable with active asset management or have a property management relationship in place.
You want to own a center anchored by a tenant with 40,000+ weekly visits and nearly zero dark-store risk.
You need a 1031 exchange replacement with institutional-quality tenancy and a clean close timeline.
You believe Florida population growth will continue driving daily-needs retail demand for the next 10–20 years.
See Available Grocery-Anchored Centers
Tell us your investment criteria and Ryan will send you current Florida grocery-anchored opportunities — on and off market — that match your goals.
Related Resources
NNN Properties Florida
Every triple net lease format trading in Central Florida, from single-tenant pads to shopping centers.
Learn more →Orlando Retail CRE Guide
A deep dive into the Orlando retail investment market — cap rates, submarkets, and deal flow.
Learn more →Deal Analyzer
Underwrite any NNN or multi-tenant retail deal with institutional-grade metrics in seconds.
Learn more →