Hospitality · STR Operations
Orlando Airbnb Occupancy Rates by Season — The STR Demand Calendar
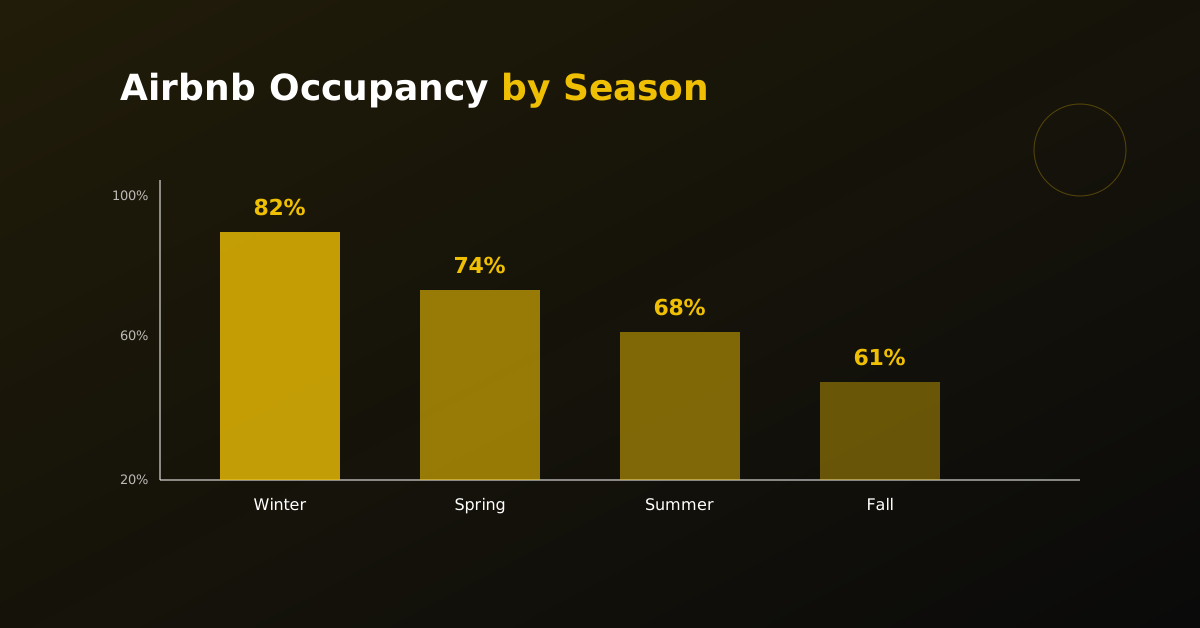
Orlando is one of the few US markets with no true off-season — but that doesn't mean demand is flat. Vacation rental occupancy swings from the high 50s in the slow weeks to the mid-90s during holidays. If you underwrite a deal using a flat annual occupancy without understanding the seasonal pattern, you'll either overpay or misprice your calendar.
Here's how Orlando vacation rental demand moves through the year, and how to build seasonality into both your underwriting and your pricing strategy.
The Orlando STR Demand Calendar
Mid-Dec – Early Jan
PEAKLate Jan – February
SLOWMarch – Mid-April
PEAKLate April – May
SHOULDERJune – Early Aug
PEAKLate Aug – Sept
SLOWOctober
SHOULDER+November
SHOULDERRanges are directional estimates for the Orlando vacation rental market and vary by property, location, amenities, and management quality. Use them to understand the shape of demand, not as guarantees.
Why Orlando Has No Real Off-Season
Unlike beach markets that die in winter or ski towns that empty in summer, Orlando's demand drivers are spread across the calendar. The theme parks operate 365 days a year, the Convention Center books events year-round, and the addition of Epic Universe in 2025 added a fourth major demand anchor. Even the “slow” weeks rarely drop below 55% occupancy — a floor most US STR markets would envy.
This matters for underwriting: your worst months still produce revenue. The risk isn't empty calendars — it's mispricing. Charging peak rates in September gets you zero bookings; charging slow-season rates in December leaves thousands on the table.
How to Underwrite Seasonality
Don't model a single flat occupancy. Instead:
- Blend to a conservative annual average. Peak weeks at 90% and slow weeks at 60% blend to roughly 72–75% across the year for a well-managed property. Underwrite at 70–72% to leave margin.
- Weight revenue toward peak rates. Because peak periods combine high occupancy AND high rates, a disproportionate share of annual revenue comes from a handful of weeks. Holidays and Spring Break can be 30–40% of annual revenue. Protect these dates.
- Stress-test the slow months. Can the property cover its fixed costs (HOA, debt service, insurance) on slow-season revenue alone? If a bad September would put you cash-negative, you need more cushion.
Pricing Strategy by Season
The operators who outperform use dynamic pricing tools (PriceLabs, Wheelhouse, Beyond) that adjust nightly rates daily based on demand, events, and competitor pricing. Manual or static pricing leaves money on the table in peak weeks and kills occupancy in slow weeks.
Slow-season tactics that work in Orlando: drop rates to capture price-sensitive travelers, offer weekly/monthly discounts to attract snowbirds and extended-stay guests, and target the “value” segment that travels specifically in off-peak windows. A property that sits empty in September at $200/night would be better booked at $130.