Neighborhood Center Investments
Neighborhood Shopping Centers in Florida
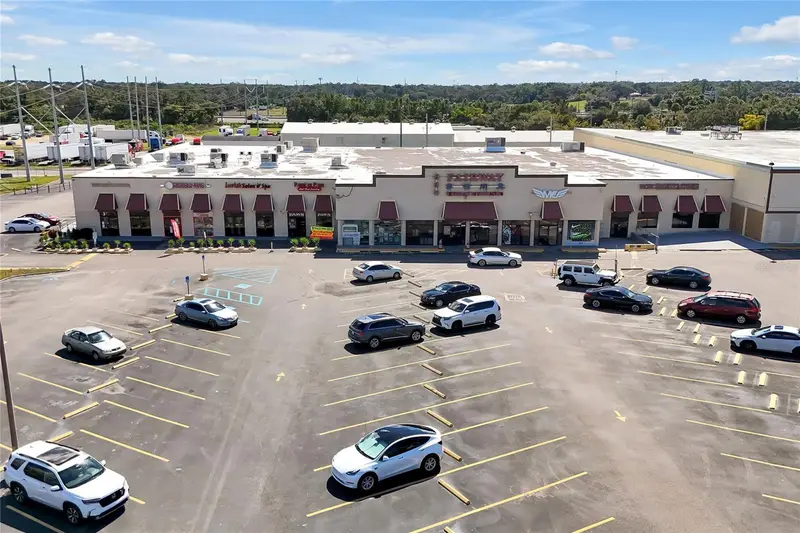
The smallest institutional shopping-center format — and the most common
Neighborhood centers are the daily-needs workhorse of Florida retail. Typically 30,000 – 125,000 SF with a single grocery or drug anchor plus 10–20 shop tenants, they serve a 3-mile trade area with essential services like pharmacy, dry cleaner, nail salon, QSR, and fitness. Cap rates typically run 6.75% – 8.00% depending on anchor credit and tenant mix.

Typical Deal Size
$4M – $18M
One anchor plus 10–20 shop tenants
Common Cap Rate
6.75% – 8.00%
Tighter with credit anchor
Trade Area
3-mile ring
30,000+ population minimum
Florida Retail Formats & Subtypes
Retail covers a dozen distinct investment profiles — from the quietest single-tenant NNN pad to the most complex regional mall. Here are the most actively traded formats in Florida today.
Grocery-Anchored Neighborhood
Publix, Winn-Dixie, Aldi, or Sprouts anchor.
Drug-Anchored Neighborhood
Walgreens or CVS pharmacy anchor plus shop tenants.
Service-Oriented Strip
No anchor — mix of fitness, medical, QSR, and service tenants.
Why Florida Is a Top-3 Retail Market in America
Population growth, tourism, retiree demographics, and no state income tax combine to give Florida retail the best long-term demand drivers in the country.
#1 Population Inflows
Florida gained roughly 365,000 net new residents in 2023 — the most of any state. Every new rooftop adds retail demand.
130M+ Annual Visitors
Florida's tourism economy drives retail sales on top of resident spending. Orlando alone hosts 74M+ visitors/year.
No State Income Tax
The absence of state income tax attracts HNW retirees and business relocations, concentrating disposable income.
Retiree Demographics
Florida has the highest 65+ population share in the country — the backbone of daily-needs retail traffic.
Corporate HQ Migration
Citadel, Goldman, Blackstone, and others have expanded Florida offices since 2020. White-collar employment supports upscale retail.
Daily-Needs Retail Resilience
Grocery, drug, dollar, auto services, and QSR are recession- and e-commerce-resistant. Florida's daily-needs base is deep.
Neighborhood Center Investing: Pros & Cons
Retail is the broadest asset class in CRE. It rewards buyers who understand tenant mix, lease structure, and trade area — and punishes those who don't.
Why Buy
Wide Risk/Reward Spectrum
From 5.5% cap passive NNN to 9%+ cap value-add, retail offers more flexibility than any other CRE asset class.
Strong 1031 Exchange Product
Single-tenant NNN retail is the most popular 1031 replacement property in America.
Inflation-Protected Cash Flow
10-year NNN leases with 10% bumps every 5 years deliver bond-like yield with inflation protection.
Tenant Pays the Expenses
True NNN passes taxes, insurance, CAM, and structural maintenance to the tenant.
Clear Exit Liquidity
Retail has the deepest secondary market in CRE — hundreds of Florida deals traded quarterly.
Value-Add Optionality
Multi-tenant and pad-site redevelopment let operators force value via curation and outparcel splits.
What to Watch
E-Commerce Vulnerability
Apparel, electronics, and soft-goods retailers are structurally challenged. Focus on service, grocery, and daily-needs tenants.
Tenant Credit Matters
Retail is only as good as its tenants. Franchisee without corporate guarantee ≠ corporate-guaranteed Walgreens.
Lease Rollover Risk
3–5 leases expiring in the same 18-month window can crater NOI if leasing velocity slows.
Site Selection Is Everything
Traffic counts, ingress/egress, demographics, and co-tenancy drive performance more than operational variables.
TI & Leasing CapEx
Even NNN deals see landlord TI and leasing commissions at rollover. Bake in realistic re-lease costs.
Who Neighborhood Center Is Best Suited For
1031 Exchange Buyers
Deadline-Driven
Buyers on a 45/180-day clock who need a clean, fast-closing NNN replacement asset.
Why It Fits
Retail NNN is the most transaction-efficient 1031 product in the country.
Passive Income Investors
Mailbox Money
Investors who want a management-free asset without TI, CapEx, or leasing activity.
Why It Fits
Absolute NNN leases from credit tenants mean zero landlord responsibilities for 10–20 years.
High-Income W-2 Earners
Tax Shelter Play
Doctors, executives, and business owners using real estate to shelter active income.
Why It Fits
Cost seg on retail pads typically allocates 20–30% of purchase price to accelerated depreciation.
Family Offices & Trusts
Long Duration
Allocators with multi-decade hold horizons who want inflation-protected income.
Why It Fits
15–20 year primary terms with 10% bumps align with generational wealth mandates.
Value-Add Operators
Force Appreciation
Sponsors who buy below-market rents, roll tenants, split pads, and sell stabilized.
Why It Fits
Multi-tenant retail offers the highest IRR potential in the asset class.
REIT / Institutional Buyers
Scale Allocators
Public and private REITs building diversified retail portfolios at $25M+ deal sizes.
Why It Fits
Grocery-anchored and power centers with institutional tenancy fit fund mandates.
Major Neighborhood Center Operators & Tenants
These are the national tenants most commonly found on Florida retail NNN leases. They drive the bulk of cap rate compression.
Publix
Florida's #1 grocery anchor. 40k+ weekly visits per store.
Walgreens / CVS
Investment-grade drug store NNN leaseback standard.
Dollar General / Dollar Tree
Aggressive Florida store growth on corporate guarantee.
Starbucks
Highest-demand pad tenant. Drive-thrus trade sub-5% caps.
Chick-fil-A / McDonald's
Ground-leased QSR pads among the most sought-after NNN in FL.
AutoZone / O'Reilly
Freestanding 15-year corporate NNN with predictable bumps.
Tractor Supply
Rural Florida growth story with long primary terms.
7-Eleven / Wawa / RaceTrac
C-store pads trade at sub-5% caps with fuel.
Note: credit quality varies. Always underwrite the specific lease guarantor, not just the brand.
Key Neighborhood Center Underwriting Metrics
The metrics experienced retail investors stress-test on every deal.
Rent per SF
$18 – $35 PSF triple net for Florida retail.
Occupancy Cost Ratio
Tenant rent / sales should sit under 10%.
Traffic Counts
15,000+ VPD minimum for shop tenants; 25,000+ for pad sites.
Trade Area Population
3-mile ring of 30,000+ supports most daily-needs formats.
Median Household Income
$55k+ HHI within 3 miles for national retail tenants.
Lease Rollover Schedule
Ladder expirations — no more than 20% rolling in any year.
Interactive Underwriting
Sample Neighborhood Center Pre-Loaded
Below is a representative Central Florida single-tenant NNN retail deal — a $3.8M drug store leaseback at a 6.25% cap with a 15-year corporate lease.
Property Type
Property & Revenue
Financing
Hold Period & Exit
When you sell, will the market be hotter, the same, or cooler than today? This determines your exit cap rate and sale price.
Conservative — you assume the market cools and buyers pay less per dollar of income. This is the safer assumption most lenders and institutional investors use.
Overall Deal Grade
B
IRR
9.97%
★★★★★Solid return
DSCR
1.10x
★★★★★Below lender minimum
Cash-on-Cash
4.62%
★★★★★Low cash yield
Equity Multiple
2.39x
★★★★★Doubled your equity
Cash Flow Analysis
NOI vs Debt Service vs Cash Flow by year
Equity Buildup
How your equity grows: loan paydown + cash flow + appreciation
Rent Schedule
Annual NOI growth over hold period
Loan Paydown
Remaining loan balance over hold period
Income & NOI
- Year 1 EGI
- $570,000
- Year 1 OPEX
- $0
- Year 1 NOI
- $570,000
- Entrance Cap Rate
- 6.71%
- Yield on Cost
- 6.71%
- 10-Yr Total NOI
- $6,385,928
Financing
- Purchase Price
- $8,500,000
- Down Payment
- $2,550,000
- Total Equity Invested
- $2,654,500
- Loan Amount
- $5,950,000
- Monthly Payment
- $43,007
- Annual Debt Service
- $516,084
- DSCR
- 1.10x
Exit & Returns
- Exit Cap Rate
- 7.21%
- Exit Year NOI
- $729,648
- Exit Value
- $10,125,730
- Selling Costs (3%)
- $303,772
- Loan Payoff
- $4,711,223
- Net Sale Proceeds
- $5,110,735
- Total Profit
- $6,335,821
Save or share
Email me this underwriting summary
Get the full metrics in your inbox — forward to lenders, partners, or yourself.
Benchmark Comparison
| Metric | Your Deal | Benchmark | Status | Insight |
|---|---|---|---|---|
| IRR | 9.97% | > 12% strong | WATCH | Moderate return |
| DSCR | 1.10x | > 1.25x lender min | WATCH | Below lender minimum — refinancing risk |
| Cash-on-Cash | 4.62% | > 6% target | WATCH | Low cash yield — appreciation play |
| Equity Multiple | 2.39x | > 2.0x strong | PASS | Doubled equity or better |
| Yield on Cost vs Exit Cap | 6.71% | 7.21% exit cap | WATCH | Buying above exit cap — assumes compression |
Suggested Offer Price
What to pay for this to be a great deal — backed into from Year 1 NOI and your financing terms so the deal meets a 1.25x DSCR lender requirement on day one.
$7,510,404
Suggested Price
at 1.25x DSCR
$8,500,000
Current Asking Price
$989,596
You Save
11.6%
Discount Off Asking
Deal Metrics at Suggested Price
| Metric | At Suggested | vs Current | Status | What This Means |
|---|---|---|---|---|
| DSCR (Year 1) | 1.25x | +0.15x | PASS | Bank-ready — meets standard lender minimum |
| Entrance Cap Rate | 7.59% | +0.88% | PASS | Higher yield = more income per dollar invested |
| Year 1 Cash-on-Cash | 4.85% | +2.82% | WATCH | Modest income — grows with rent bumps |
| Down Payment | $2,253,121 | -$296,879 less | SAVINGS | $2,253,121 down + $97,573 closing = $2,350,694 total cash to close |
| Loan Amount | $5,257,283 | -$692,717 | $38,000/mo | $5,257,283 loan at 7.25% = $38,000/mo debt service |
Offer $7,510,404 (11.6% below asking) to hit 1.25x DSCR. You'd need $2,253,121 down vs $2,550,000 today — saving $296,879 in equity. Monthly payment drops from $43,007 to $38,000.
Sensitivity Matrix
Exit value at different cap rate and NOI growth combinations
| Exit Cap / Growth | 0% Growth | 1% Growth | 2% Growth | 3% Growth | 4% Growth |
|---|---|---|---|---|---|
| 5.71% | $9,989,691 | $11,034,833 | $12,177,377 | $13,425,309 | $14,787,183 |
| 6.21% | $9,184,834 | $10,145,771 | $11,196,262 | $12,343,649 | $13,595,798 |
| 6.71% | $8,500,000 | $9,389,288 | $10,361,453 | $11,423,289 | $12,582,076 |
| 7.21% | $7,910,204 | $8,737,786 | $9,642,495 | $10,630,653 | $11,709,034 |
| 7.71% | $7,396,947 | $8,170,831 | $9,016,837 | $9,940,878 | $10,949,288 |
Green = exit value exceeds purchase price. Red = exit value below purchase price.
Year-by-Year Cash Flows
Metric Glossary
IRR
Internal Rate of Return — the annualized return on every dollar you invest, accounting for timing of cash flows.
Equity Multiple
Total money returned divided by total money invested. 2.0x = you doubled your money.
Cash-on-Cash
Annual cash flow as a percentage of your invested equity. Measures what the property pays you now.
DSCR
Debt Service Coverage Ratio — how many times NOI covers the mortgage. Lenders require 1.25x minimum.
Cap Rate
NOI divided by property value. The return assuming all-cash purchase. Lower cap = higher price.
NOI
Net Operating Income — rent minus operating expenses, before mortgage payments.
Yield on Cost
Year 1 NOI divided by purchase price. The cap rate you created for yourself as a buyer.
Exit Cap
The assumed cap rate when you sell. Higher exit cap = lower sale price (conservative).
For informational and educational purposes only. Not financial or investment advice. Consult a licensed professional before making investment decisions.
Want to underwrite a different asset class? Open the full Deal Analyzer
Browse Live Neighborhood Center Listings
Current neighborhood center properties for sale across Central Florida — live from Stellar MLS, no Crexi or LoopNet detour.
$15.00M
5510 W Colonial Dr
Orlando, FL 32808
37,291 SF · 4.24 ac · Built 1978
MLS #O6357931, AFFINITY REALTY LLC.
Listing provided by Stellar MLS
$14.00M
4500 N Tamiami Trl
Sarasota, FL 34234
4,714 SF · 0.55 ac · Built 1973
Phillips John Sub Rep Of
MLS #TB8489540, PEOPLE'S TRUST REALTY.
Listing provided by Stellar MLS
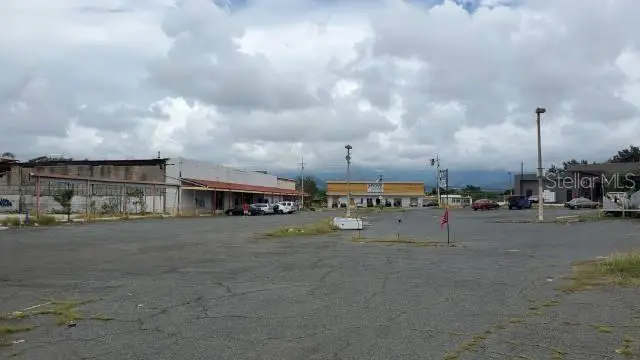
$10.50M
Pr-116 Int. Pr-121
Yauco, PR 00698
4.64 ac · Built 1990
Yauco Shopping Center
MLS #PR9097539, WINER PROPERTY GROUP.
Listing provided by Stellar MLS
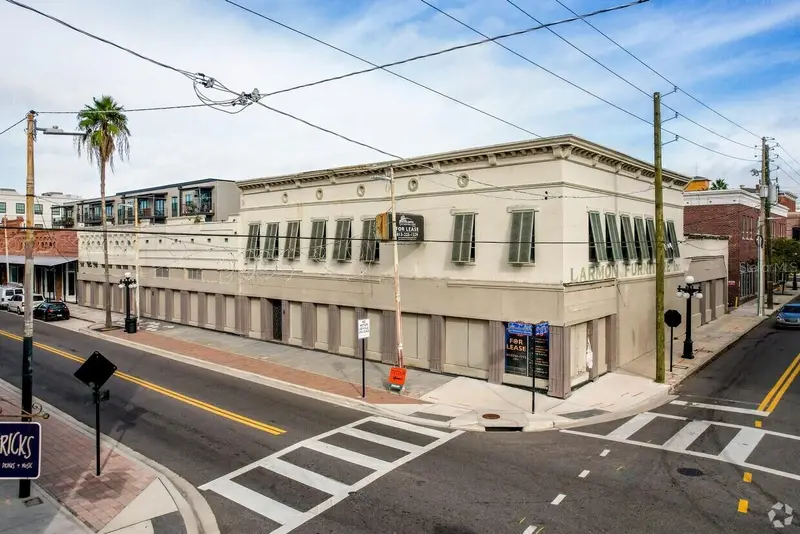
$9.99M
1324 E 7th Ave
Tampa, FL 33605
21,555 SF · 0.35 ac · Built 1905
Ybor City Blk Y
MLS #TB8491237, FLORIDA COMMERCIAL GROUP.
Listing provided by Stellar MLS
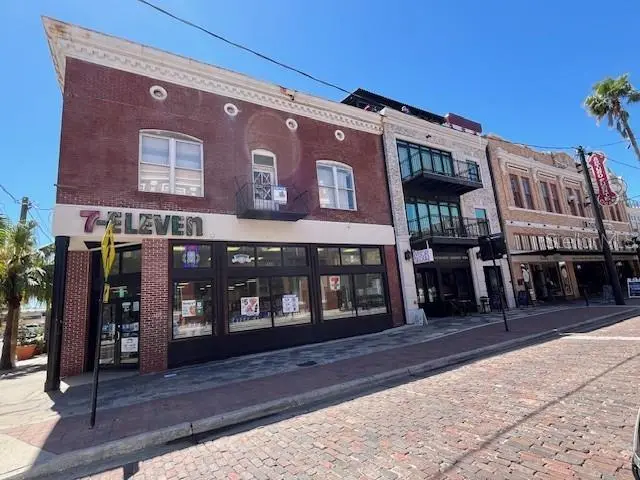
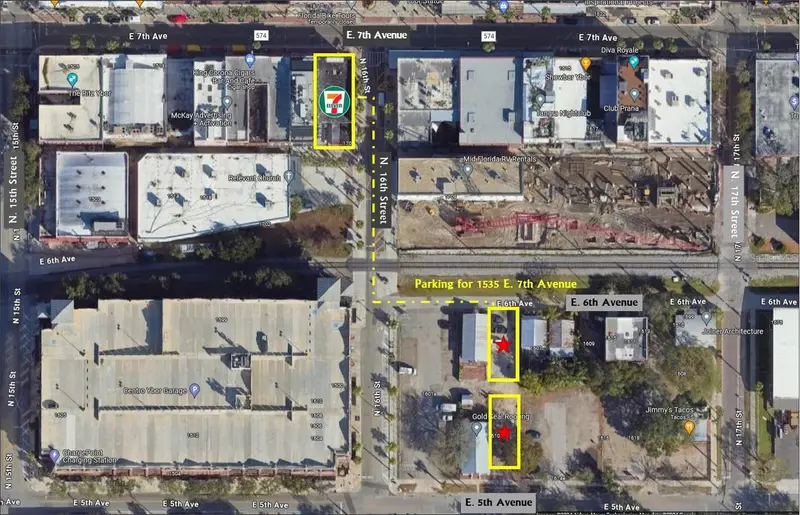
$6.95M
1535 E 7th Ave
Tampa, FL 33605
7,114 SF · 0.09 ac · Built 1908
Ybor City Blk Y
MLS #T3401081, FLORIDA COMMERCIAL GROUP.
Listing provided by Stellar MLS
$6.60M
418 N Dale Mabry Hwy
Tampa, FL 33609
13,000 SF · 0.68 ac · Built 1987
Broadmoor Park Rev
MLS #TB8515732, SOUTH CEDAR REAL ESTATE, INC.
Listing provided by Stellar MLS
Listings courtesy of Stellar MLS as distributed by MLS GRID. Data deemed reliable but not guaranteed.
Browse Active Listings
Neighborhood Center Deals on Major CRE Marketplaces
Want to see what's publicly listed right now? These marketplaces aggregate on-market retail opportunities across Florida.
Crexi
Tech-forward CRE marketplace
Largest growing inventory of Florida retail listings, with detailed deal rooms and OM downloads.
LoopNet
Largest CRE listings network
The biggest pool of retail listings in Florida. Search by city, county, or statewide.
CBRE Deal Flow
Institutional broker platform
CBRE's deal marketplace for institutional and mid-market retail across Florida.
The best retail deals rarely hit these marketplaces. For off-market opportunities being traded between operators, family offices, and 1031 buyers, tell us what you're looking for.
Frequently Asked Questions
Neighborhood Center Investor FAQ
The questions we get most often from investors evaluating Florida retail deals.
What's a typical cap rate for Florida retail in 2025?
Single-tenant NNN retail with credit tenants is trading between 5.5% and 6.75% in Central Florida. Multi-tenant strip centers range from 6.5% to 8.0%. Grocery-anchored centers sit at 6.0% – 7.25%.
Is Florida retail safe from e-commerce pressure?
Not all retail. Apparel and soft-goods are challenged nationwide. Grocery, drug, QSR, auto services, fitness, medical, and daily-needs formats are largely Amazon-proof and dominate the Florida pipeline.
What's the difference between NNN and absolute NNN?
True NNN passes taxes, insurance, and CAM but landlord keeps roof/structure. Absolute NNN makes the tenant responsible for everything including roof and structure — the truly passive structure.
Can I 1031 exchange into retail?
Yes. Single-tenant NNN retail is the single most popular 1031 replacement product in America. Fast closes, clean leases, deep Florida deal flow.
How do I underwrite tenant credit?
Look for (1) corporate lease guarantees vs franchisee, (2) public parent credit rating, (3) store-level sales reporting, (4) occupancy cost ratio under 10%, (5) national footprint growth trajectory.
What's the minimum deal size for Florida retail?
Single-tenant NNN pads start around $1.5M – $2M for smaller QSR or dollar-store leasebacks. Strip centers start at $3M; institutional shopping centers at $8M – $10M.
What are typical retail lease terms in Florida?
15-year initial term is standard for single-tenant NNN. 5- or 10-year terms for multi-tenant strip tenants. Rent bumps usually 10% every 5 years with 2–4 renewal options.
Is This You?
Quick Fit Check
If you nod "yes" to three or more of these, Florida retail deserves a slot on your shortlist.
You want a broad spectrum of passive, management-light investment options.
You value long lease terms from corporate-credit or investment-grade tenants.
You need the bonus depreciation and cost segregation benefits of fee-simple real estate.
You're on a 1031 exchange clock and need a fast-closing NNN deal.
You want exposure to Florida's population growth and retirement demographics.
See Available Neighborhood Centers
Tell us about your retail investment criteria and we will send you current Florida opportunities — on and off market.
Related Resources
NNN Properties Florida
Every triple net lease format trading in Central Florida.
Learn more →Orlando Cap Rates Investor Guide
Current cap rate trends by property type across the Orlando MSA.
Learn more →Car Wash Properties Florida
Deep dive on one of the fastest-consolidating retail-adjacent asset classes.
Learn more →