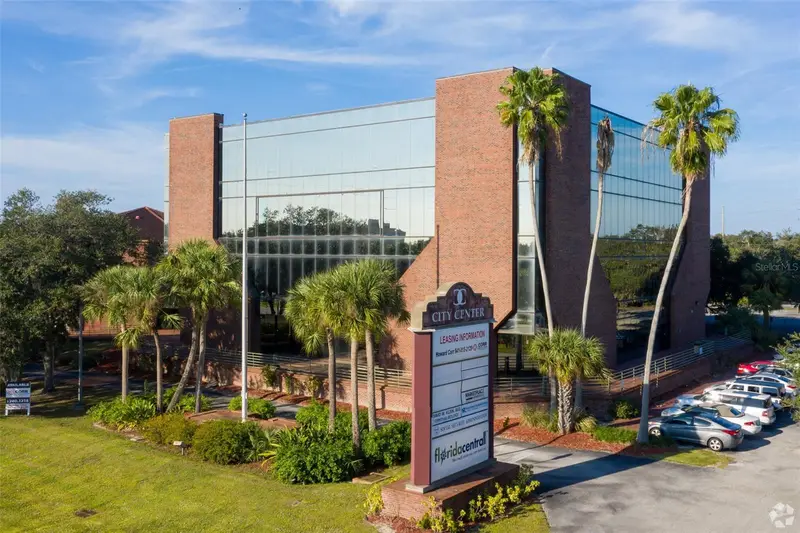
Government-Leased Office
Government Office Buildings in Florida
GSA, state, and county-leased office with credit government tenants
Government-leased office buildings house federal GSA, state, county, and municipal tenants on long-term leases backed by the full faith and credit of the issuing government entity. The sub-category trades at tighter cap rates than comparable Class B office thanks to tenant credit quality — though GSA leases often carry termination-for-convenience clauses that require careful underwriting.

Typical Deal Size
$4M – $40M
Single-tenant government-leased
Common Cap Rate
7.00% – 8.50%
Government credit tenancy
Lease Term
10 – 20 years
With termination clauses to watch
Government Office Property Formats
Class A Office
Trophy institutional-quality buildings with credit tenants. Tightest office cap rates.
Class B / Value-Add
Older buildings with reposition potential. Highest IRR for operators who can execute.
Medical Office Building (MOB)
Strongest office subcategory. Sticky tenants, specialty build-out, investment-grade demand.
Office Condo
User-owner product. Practices buy their own suite to control occupancy and build equity.
Creative / Loft Office
Converted warehouse and loft space. Appeals to tech, creative, and startup tenants.
Suburban Office Park
Multi-building campuses in suburban Florida. Wider caps reflect category pressure.
Government Office Investing: Pros & Cons
Office is the most dislocated CRE asset class in America — dangerous for the uninformed, opportunity-rich for the informed. Here's the honest picture.
Why Buy
Basis Dislocation Opportunity
Class B/C Florida office is trading at 40–60% discounts to replacement cost. Generational basis for patient operators.
Florida Office Outperformance
Florida office markets have seen positive absorption and rent growth while coastal gateway cities struggle.
Medical Office Stability
MOB has held up through every downturn. Specialty build-out, sticky tenants, and healthcare demand growth.
Owner-Occupier Demand
Office condos are in steady demand from professional services firms locking in occupancy costs.
Long Leases on Renewal
When stabilized office renews, it tends to renew for 5–10+ year terms — durable once you're past rollover.
What to Watch
Remote Work Headwinds
Hybrid work has permanently reduced office demand in many submarkets. Underwrite physical occupancy carefully.
CapEx Intensive
Office requires heavy TI ($50–$150 PSF) and leasing commissions on every renewal. Model cash flow conservatively.
Financing Is Difficult
Lenders are extremely cautious on office. Expect higher rates, lower LTVs, and more scrutiny than other asset classes.
Rollover Risk
Tenant rollover in a weak leasing environment can crater NOI. Always ladder expirations.
Exit Cap Expansion
Underwrite meaningful exit cap expansion — 50–100 bps over entry is conservative in current environment.
Who Government Office Is Best Suited For
Owner-Occupiers
User-Buyers
Professional service firms buying their own space to lock in occupancy costs and build equity.
Why It Fits
Office condos and small Class B buildings are ideal for 10+ year user-owners.
Value-Add Sponsors
Reposition Plays
Sponsors buying distressed or dated office and repositioning through capital improvements and re-tenanting.
Why It Fits
Class B/C Florida office has meaningful basis dislocation — great for operators who can execute.
Medical Practice Groups
Healthcare Specialists
Growing medical and dental practice groups buying or building specialty medical office space.
Why It Fits
Medical office is the strongest office subcategory in Florida with investment-grade demand.
Family Offices
Core-Plus
Allocators with long hold horizons willing to invest in stabilized office at wider cap rates.
Why It Fits
Well-located Class A with credit tenants offers durable cash flow and basis protection.
Key Government Office Underwriting Metrics
Office underwriting has gotten much more rigorous post-2022. Stress-test everything.
Rent PSF (Full-Service)
$22 – $48 PSF depending on class and submarket
TI Allowance
$40 – $100+ PSF for new tenants; $15 – $40 PSF renewals
Leasing Commissions
4–6% of lease value new; 2–3% renewals
Operating Expenses
$10 – $16 PSF for Florida suburban office
Physical Occupancy
Underwrite to actual physical occupancy, not leased rate
Parking Ratio
4 – 5 spaces per 1,000 SF for suburban Florida office
Interactive Underwriting
Sample Office Value-Add Deal Pre-Loaded
A representative Orlando Class B office reposition deal — $8.5M purchase at a 9.0% going-in cap with stabilized yield north of 11%.
Property Type
Property & Revenue
Financing
Hold Period & Exit
When you sell, will the market be hotter, the same, or cooler than today? This determines your exit cap rate and sale price.
Conservative — you assume the market cools and buyers pay less per dollar of income. This is the safer assumption most lenders and institutional investors use.
Overall Deal Grade
B-
IRR
7.63%
★★★★★Below target
DSCR
1.17x
★★★★★Below lender minimum
Cash-on-Cash
4.55%
★★★★★Low cash yield
Equity Multiple
1.61x
★★★★★Solid equity growth
Cash Flow Analysis
NOI vs Debt Service vs Cash Flow by year
Equity Buildup
How your equity grows: loan paydown + cash flow + appreciation
Rent Schedule
Annual NOI growth over hold period
Loan Paydown
Remaining loan balance over hold period
Income & NOI
- Year 1 EGI
- $596,700
- Year 1 OPEX
- $0
- Year 1 NOI
- $596,700
- Entrance Cap Rate
- 7.02%
- Yield on Cost
- 7.02%
- 7-Yr Total NOI
- $4,572,191
Financing
- Purchase Price
- $8,500,000
- Down Payment
- $2,975,000
- Total Equity Invested
- $3,107,875
- Loan Amount
- $5,525,000
- Monthly Payment
- $42,643
- Annual Debt Service
- $511,714
- DSCR
- 1.17x
Exit & Returns
- Exit Cap Rate
- 8.02%
- Exit Year NOI
- $733,866
- Exit Value
- $9,150,446
- Selling Costs (3%)
- $274,513
- Loan Payoff
- $4,873,676
- Net Sale Proceeds
- $4,002,256
- Total Profit
- $4,992,448
Save or share
Email me this underwriting summary
Get the full metrics in your inbox — forward to lenders, partners, or yourself.
Benchmark Comparison
| Metric | Your Deal | Benchmark | Status | Insight |
|---|---|---|---|---|
| IRR | 7.63% | > 12% strong | FAIL | Below target for illiquid real estate |
| DSCR | 1.17x | > 1.25x lender min | WATCH | Below lender minimum — refinancing risk |
| Cash-on-Cash | 4.55% | > 6% target | WATCH | Low cash yield — appreciation play |
| Equity Multiple | 1.61x | > 2.0x strong | WATCH | Modest total return |
| Yield on Cost vs Exit Cap | 7.02% | 8.02% exit cap | FAIL | Buying above exit cap — assumes compression |
Suggested Offer Price
What to pay for this to be a great deal — backed into from Year 1 NOI and your financing terms so the deal meets a 1.25x DSCR lender requirement on day one.
$7,929,349
Suggested Price
at 1.25x DSCR
$8,500,000
Current Asking Price
$570,651
You Save
6.7%
Discount Off Asking
Deal Metrics at Suggested Price
| Metric | At Suggested | vs Current | Status | What This Means |
|---|---|---|---|---|
| DSCR (Year 1) | 1.25x | +0.08x | PASS | Bank-ready — meets standard lender minimum |
| Entrance Cap Rate | 7.53% | +0.51% | PASS | Higher yield = more income per dollar invested |
| Year 1 Cash-on-Cash | 4.11% | +1.38% | WATCH | Modest income — grows with rent bumps |
| Down Payment | $2,775,272 | -$199,728 less | SAVINGS | $2,775,272 down + $127,311 closing = $2,902,583 total cash to close |
| Loan Amount | $5,154,077 | -$370,923 | $39,780/mo | $5,154,077 loan at 8.0% = $39,780/mo debt service |
Offer $7,929,349 (6.7% below asking) to hit 1.25x DSCR. You'd need $2,775,272 down vs $2,975,000 today — saving $199,728 in equity. Monthly payment drops from $42,643 to $39,780.
Sensitivity Matrix
Exit value at different cap rate and NOI growth combinations
| Exit Cap / Growth | 0% Growth | 1% Growth | 2% Growth | 3% Growth | 4% Growth |
|---|---|---|---|---|---|
| 6.02% | $9,911,960 | $10,626,963 | $11,385,727 | $12,190,461 | $13,043,463 |
| 6.52% | $9,151,840 | $9,812,012 | $10,512,588 | $11,255,609 | $12,043,198 |
| 7.02% | $8,500,000 | $9,113,150 | $9,763,828 | $10,453,928 | $11,185,420 |
| 7.52% | $7,934,840 | $8,507,223 | $9,114,637 | $9,758,853 | $10,441,709 |
| 8.02% | $7,440,150 | $7,976,847 | $8,546,393 | $9,150,446 | $9,790,729 |
Green = exit value exceeds purchase price. Red = exit value below purchase price.
Year-by-Year Cash Flows
Metric Glossary
IRR
Internal Rate of Return — the annualized return on every dollar you invest, accounting for timing of cash flows.
Equity Multiple
Total money returned divided by total money invested. 2.0x = you doubled your money.
Cash-on-Cash
Annual cash flow as a percentage of your invested equity. Measures what the property pays you now.
DSCR
Debt Service Coverage Ratio — how many times NOI covers the mortgage. Lenders require 1.25x minimum.
Cap Rate
NOI divided by property value. The return assuming all-cash purchase. Lower cap = higher price.
NOI
Net Operating Income — rent minus operating expenses, before mortgage payments.
Yield on Cost
Year 1 NOI divided by purchase price. The cap rate you created for yourself as a buyer.
Exit Cap
The assumed cap rate when you sell. Higher exit cap = lower sale price (conservative).
For informational and educational purposes only. Not financial or investment advice. Consult a licensed professional before making investment decisions.
Want to underwrite a different asset class? Open the full Deal Analyzer
Browse Live Government Office Listings
Current government office properties for sale across Central Florida — live from Stellar MLS, no Crexi or LoopNet detour.

$79.45M
290 Rua De Santos Pousada
Porto, OC
2.7 ac · Built 1996
MLS #O6421981, ALEXANDRE V-SMEJDA LLC.
Listing provided by Stellar MLS
$15.00M
7625 Sinclair Rd
Kissimmee, FL 34747
2,500 SF · 13.31 ac · Built 2014
Sinclair Corners
MLS #R4910040, RICHARD L. FULLERTON INC.
Listing provided by Stellar MLS
$11.50M
6801 E Hillsborough Ave
Tampa, FL 33610
5.22 ac · Built 1982
MLS #TB8362309, SUNCOAST REALTY SOLUTIONS, LLC.
Listing provided by Stellar MLS
$9.99M
1620 Tamiami Trl
Port Charlotte, FL 33948
49,172 SF · 3.24 ac · Built 1992
MLS #A4678191, RE/MAX ALLIANCE GROUP.
Listing provided by Stellar MLS
$7.00M
19995 Us Highway 19 N
Clearwater, FL 33764
8,335 SF · 1.79 ac · Built 1975
MLS #TB8508225, ENGEL & VOLKERS MADEIRA BEACH.
Listing provided by Stellar MLS
$6.97M
8946 77th Ter E
Lakewood Ranch, FL 34202
8,046 SF · 0.18 ac · Built 2009
Professional Center At Lakewood R 8, 9&10
MLS #A4688412, SVN COMMERCIAL ADVISORY GROUP.
Listing provided by Stellar MLS
Listings courtesy of Stellar MLS as distributed by MLS GRID. Data deemed reliable but not guaranteed.
Browse Active Listings
Government Office Deals on Major CRE Marketplaces
Want to see what's publicly listed? These marketplaces aggregate on-market Florida office opportunities.
Crexi
Tech-forward CRE marketplace
Growing inventory of Florida office listings with detailed financials.
LoopNet
Largest CRE listings network
The biggest pool of office listings in Florida.
CBRE Deal Flow
Institutional broker platform
Institutional office opportunities across Florida.
The best office deals — especially distressed basis plays — rarely hit these marketplaces. tell us what you're looking for.
Frequently Asked Questions
Government Office Investor FAQ
The questions we get most often from investors evaluating Florida office.
Is Florida office different from the national office story?
Yes. Florida office markets — Tampa, Orlando, Jacksonville, Miami — have seen positive net absorption and rent growth in 2023-2024 while coastal gateway markets (SF, NY, Chicago) have declined. Corporate HQ migration, no state income tax, and a return-to-office culture drive Florida's outperformance.
What's medical office and why is it different?
Medical Office Buildings (MOB) house physicians, dentists, imaging, and outpatient services. They trade at meaningfully tighter cap rates than traditional office because of sticky tenants (specialty build-out), demographic tailwinds from an aging population, and investment-grade health system tenancy.
How do I underwrite office TI and leasing CapEx?
Budget $50-$100 PSF for new tenant TI in Class A, $30–$60 PSF in Class B. Add 4–6% leasing commissions on new leases and 2–3% on renewals. Underwrite conservative assumptions — office leasing has gotten harder, not easier.
Can I finance office deals today?
Yes, but financing is materially harder than pre-2022. Expect 55–65% LTV on stabilized office, higher interest rates, and much more lender scrutiny. Class A in strong submarkets still gets done; Class B/C often requires creative structure like seller financing, bridge debt, or cash purchases.
Is This You?
Quick Fit Check
If you nod "yes" to three or more of these, Florida office has a place in your portfolio.
You believe Florida office fundamentals have decoupled from coastal gateway markets.
You're comfortable with active leasing, TI, and value-add execution.
You want to buy at generational basis dislocation versus replacement cost.
You have patient capital and a 5–10 year hold horizon.
You want exposure to medical office or owner-occupier office condo demand.
See Available Government Office Buildings
Tell us about your office investment criteria and we will send you current Florida opportunities.