Multifamily Investment Opportunities
Low-Rise & Walk-Up Apartments in Florida
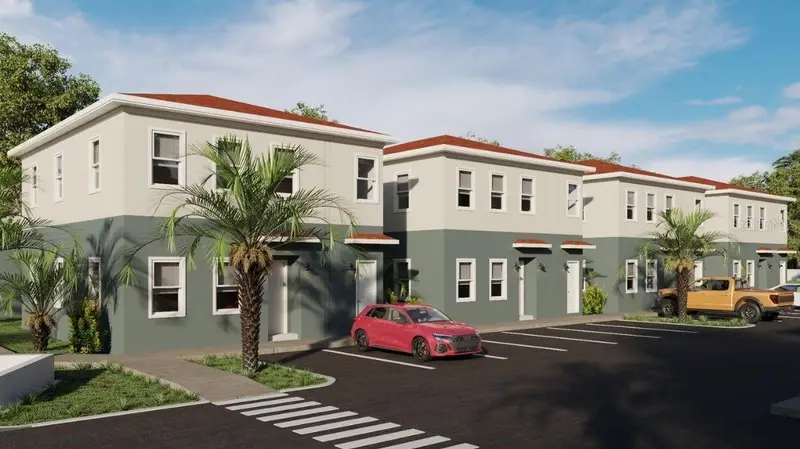
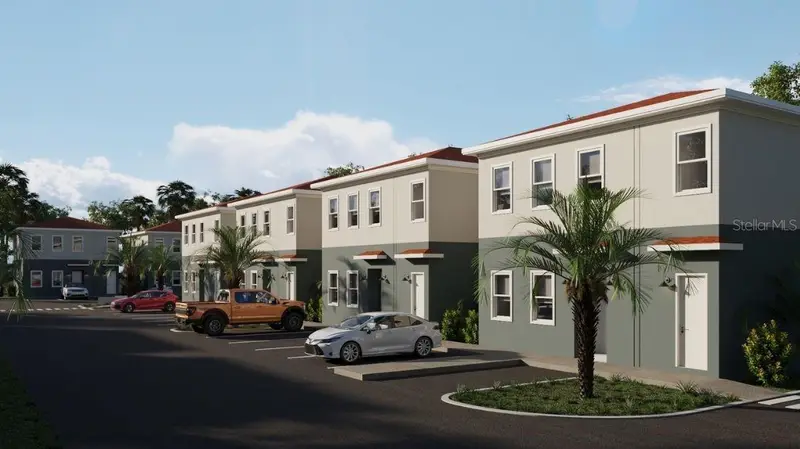
Classic 2-story stair-access apartment communities
Low-rise walk-up apartments are 2-story stair-accessible buildings that make up a significant portion of Florida's older apartment stock. Often 1970s–1990s vintage, they represent classic value-add opportunities for sponsors who can execute unit renovations and rent push strategies.

Typical Deal Size
$3M – $25M
Small-to-mid walk-up communities
Common Cap Rate
6.00% – 7.50%
Value-add vintage product
Unit Count
30 – 150
Stair-access density
Low-Rise / Walk-Up Property Formats
Class A Garden / Mid-Rise
Newly built institutional product in growth submarkets.
Class B Value-Add
1980s–2000s product with renovation and rent-push upside.
Class C / Workforce
Older product serving workforce renter base. Higher yield, higher operations risk.
High-Rise / Luxury
Premium urban high-rise in downtown Orlando, Tampa, and Miami.
Student Housing
Purpose-built student housing near UF, FSU, UCF, and USF.
Affordable / LIHTC
Income-restricted product with tax credit equity and subsidy programs.
Why Florida Multifamily Outperforms the Nation
#1 Population Inflows
365k+ net new residents in 2023 — all of whom need somewhere to live.
No State Income Tax
Migration driver for HNW and remote workers. Apartment demand follows.
Job Growth Above Trend
Florida job growth has outpaced the nation for the past decade.
Housing Affordability Gap
Single-family prices have climbed faster than incomes — renters stay renters longer.
Hurricane-Resilient Demand
Multifamily recovers faster than single-family after storm events.
Deep Institutional Liquidity
Florida is the largest multifamily trading market in the Southeast.
Low-Rise / Walk-Up Investing: Pros & Cons
Multifamily is the most institutional CRE asset class. But current-cycle underwriting requires more discipline than ever.
Why Buy
Population Growth Tailwind
Florida's net migration underwrites apartment demand for a decade or more.
Deep Institutional Liquidity
Always an active buyer pool — exit is rarely the binding constraint.
Agency Debt Availability
Fannie and Freddie provide low-cost, long-duration multifamily debt — rare across CRE.
Value-Add Upside
1980s–2000s product has clear renovation and rent-push upside in every Florida MSA.
Inflation-Indexed Rents
Annual lease rollover captures inflation faster than 10-year NNN retail or office.
Tax Shelter Benefits
Cost segregation and bonus depreciation are particularly effective on multifamily.
What to Watch
Cap Rate Compression Ceiling
Entry caps are historically tight — meaningful rent growth needed to deliver target returns.
Supply Pressure
New deliveries in some Florida submarkets are softening rent growth in Class A.
Insurance Cost Explosion
Florida multifamily insurance has doubled or tripled since 2020. Underwrite conservatively.
Active Operations
Multifamily is a management-intensive asset class — great sponsors beat average ones by meaningful margins.
Regulatory Risk
Local rent control, tenant protection, and lease restrictions have spread to parts of Florida.
Who Low-Rise / Walk-Up Is Best Suited For
Institutional Sponsors
Core / Core-Plus
REITs, insurance capital, and pension funds building Sunbelt multifamily portfolios at scale.
Why It Fits
Florida sits at the top of every institutional multifamily allocation model.
Value-Add Syndicators
Force Appreciation
Sponsors buying 1980s–2000s product, renovating units, and pushing rents to market.
Why It Fits
Classic value-add plays deliver 12–18%+ IRR when executed well in growth markets.
1031 Exchange Buyers
Deadline-Driven
Buyers on a 45/180-day clock looking for stabilized multifamily replacement product.
Why It Fits
Florida multifamily offers deep inventory and fast-close execution.
Private Family Offices
Long Duration
Multi-generational wealth managers holding Sunbelt multifamily for 15+ years.
Why It Fits
Inflation-protected cash flow with population growth tailwinds aligns with long holds.
Key Low-Rise / Walk-Up Underwriting Metrics
Rent PSF
$1.80 – $3.20 per SF per month for Florida apartments
Occupancy
Stabilized should run 93%+ economic occupancy
Operating Expense Ratio
38–48% of EGI for professionally managed product
Insurance Cost
$600 – $1,500+ per unit per year in Florida — has doubled in 5 years
Cap Ex Reserve
$250 – $400 per unit per year minimum
Rent Growth Stress Test
Model flat or 1% growth as conservative downside case
Interactive Underwriting
Sample Value-Add Multifamily Deal Pre-Loaded
A representative Orlando-area 1990s Class B value-add apartment complex — $28M purchase, 140 units at $200k/door with renovation upside.
Property Type
Property & Revenue
Operating Expenses
Enter an expense ratio OR individual line items below
Or Line Items
Financing
Hold Period & Exit
When you sell, will the market be hotter, the same, or cooler than today? This determines your exit cap rate and sale price.
Conservative — you assume the market cools and buyers pay less per dollar of income. This is the safer assumption most lenders and institutional investors use.
Overall Deal Grade
C
IRR
8.65%
★★★★★Below target
DSCR
1.02x
★★★★★Negative cash flow risk
Cash-on-Cash
1.54%
★★★★★Near zero cash flow
Equity Multiple
1.51x
★★★★★Solid equity growth
Cash Flow Analysis
NOI vs Debt Service vs Cash Flow by year
Equity Buildup
How your equity grows: loan paydown + cash flow + appreciation
Rent Schedule
Annual NOI growth over hold period
Loan Paydown
Remaining loan balance over hold period
Income & NOI
- Year 1 EGI
- $2,605,680
- Year 1 OPEX
- $1,094,386
- Year 1 NOI
- $1,511,294
- Entrance Cap Rate
- 5.40%
- Yield on Cost
- 5.40%
- 5-Yr Total NOI
- $8,104,265
Financing
- Purchase Price
- $28,000,000
- Down Payment
- $8,400,000
- Total Equity Invested
- $8,736,000
- Loan Amount
- $19,600,000
- Monthly Payment
- $123,885
- Annual Debt Service
- $1,486,624
- DSCR
- 1.02x
Exit & Returns
- Exit Cap Rate
- 5.65%
- Exit Year NOI
- $1,794,944
- Exit Value
- $31,783,090
- Selling Costs (3%)
- $953,493
- Loan Payoff
- $18,347,752
- Net Sale Proceeds
- $12,481,846
- Total Profit
- $13,152,991
Save or share
Email me this underwriting summary
Get the full metrics in your inbox — forward to lenders, partners, or yourself.
Benchmark Comparison
| Metric | Your Deal | Benchmark | Status | Insight |
|---|---|---|---|---|
| IRR | 8.65% | > 12% strong | WATCH | Moderate return |
| DSCR | 1.02x | > 1.25x lender min | FAIL | Below lender minimum — refinancing risk |
| Cash-on-Cash | 1.54% | > 6% target | FAIL | Low cash yield — appreciation play |
| Equity Multiple | 1.51x | > 2.0x strong | WATCH | Modest total return |
| Yield on Cost vs Exit Cap | 5.40% | 5.65% exit cap | WATCH | Buying above exit cap — assumes compression |
Suggested Offer Price
What to pay for this to be a great deal — backed into from Year 1 NOI and your financing terms so the deal meets a 1.25x DSCR lender requirement on day one.
$22,771,726
Suggested Price
at 1.25x DSCR
$28,000,000
Current Asking Price
$5,228,274
You Save
18.7%
Discount Off Asking
Deal Metrics at Suggested Price
| Metric | At Suggested | vs Current | Status | What This Means |
|---|---|---|---|---|
| DSCR (Year 1) | 1.25x | +0.23x | PASS | Bank-ready — meets standard lender minimum |
| Entrance Cap Rate | 6.64% | +1.24% | PASS | Higher yield = more income per dollar invested |
| Year 1 Cash-on-Cash | 4.24% | +3.96% | WATCH | Modest income — grows with rent bumps |
| Down Payment | $6,831,518 | -$1,568,482 less | SAVINGS | $6,831,518 down + $299,402 closing = $7,130,920 total cash to close |
| Loan Amount | $15,940,208 | -$3,659,792 | $100,753/mo | $15,940,208 loan at 6.5% = $100,753/mo debt service |
Offer $22,771,726 (18.7% below asking) to hit 1.25x DSCR. You'd need $6,831,518 down vs $8,400,000 today — saving $1,568,482 in equity. Monthly payment drops from $123,885 to $100,753.
Sensitivity Matrix
Exit value at different cap rate and NOI growth combinations
| Exit Cap / Growth | 0% Growth | 1% Growth | 2% Growth | 3% Growth | 4% Growth |
|---|---|---|---|---|---|
| 4.40% | $34,367,283 | $36,120,360 | $37,944,258 | $39,841,100 | $41,813,055 |
| 4.90% | $30,858,613 | $32,432,712 | $34,070,402 | $35,773,590 | $37,544,221 |
| 5.40% | $28,000,000 | $29,428,281 | $30,914,262 | $32,459,674 | $34,066,281 |
| 5.90% | $25,626,105 | $26,933,294 | $28,293,290 | $29,707,679 | $31,178,075 |
| 6.40% | $23,623,277 | $24,828,301 | $26,082,006 | $27,385,852 | $28,741,328 |
Green = exit value exceeds purchase price. Red = exit value below purchase price.
Year-by-Year Cash Flows
Metric Glossary
IRR
Internal Rate of Return — the annualized return on every dollar you invest, accounting for timing of cash flows.
Equity Multiple
Total money returned divided by total money invested. 2.0x = you doubled your money.
Cash-on-Cash
Annual cash flow as a percentage of your invested equity. Measures what the property pays you now.
DSCR
Debt Service Coverage Ratio — how many times NOI covers the mortgage. Lenders require 1.25x minimum.
Cap Rate
NOI divided by property value. The return assuming all-cash purchase. Lower cap = higher price.
NOI
Net Operating Income — rent minus operating expenses, before mortgage payments.
Yield on Cost
Year 1 NOI divided by purchase price. The cap rate you created for yourself as a buyer.
Exit Cap
The assumed cap rate when you sell. Higher exit cap = lower sale price (conservative).
For informational and educational purposes only. Not financial or investment advice. Consult a licensed professional before making investment decisions.
Want to underwrite a different asset class? Open the full Deal Analyzer
Browse Live Low-Rise / Walk-Up Listings
Current low-rise / walk-up properties for sale across Central Florida — live from Stellar MLS, no Crexi or LoopNet detour.
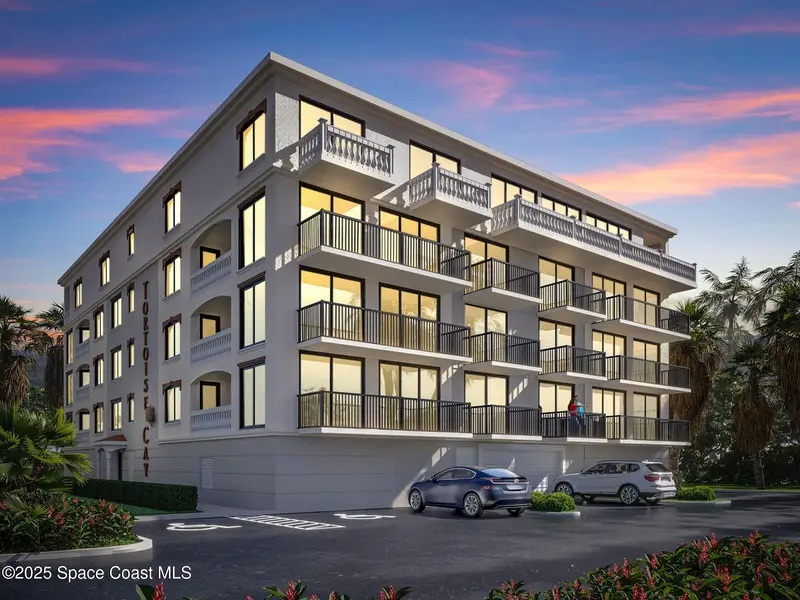

$13.50M
327 Wilson Avenue, Cocoa Beach, Fl 32931
Cocoa Beach, FL 32931
34,878 SF · 0.56 ac · Built 2026
Avon By The Sea
MLS #1038375, One Sotheby's International.
Listing provided by Space Coast MLS (Space Coast Association of REALTORS®)
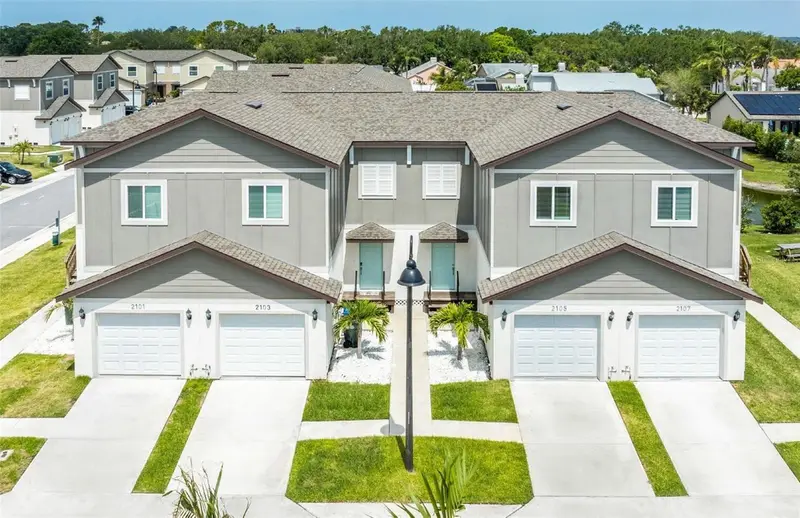
$11.75M
3301 Whitney Rd #2102, 2104, 2106, Et Al.
Clearwater, FL 33760
1,790 SF · 3.2 ac · Built 2023
Whitney Twnhms
MLS #TB8469343, SCHERER DEVELOPMENT LLC.
Listing provided by Stellar MLS
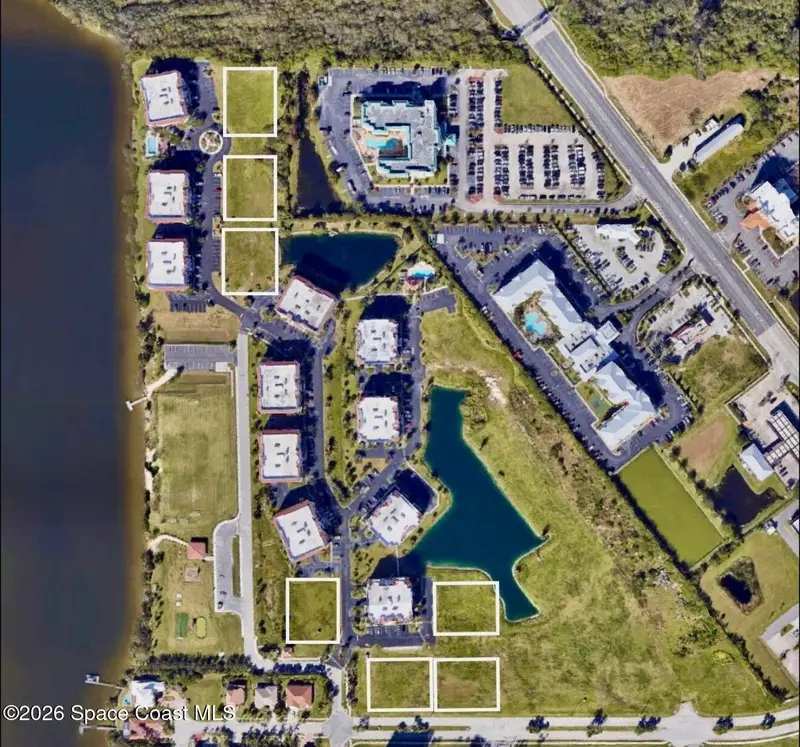

$8.25M
(Multiple) Puerto Del Rio Drive, Cape Canaveral, Fl 32920
Cape Canaveral, FL 32920
55,000 SF · 7.5 ac · Built 2028
Puerto Del Rio Condo Ph 1a
MLS #1079947, One Sotheby's International.
Listing provided by Space Coast MLS (Space Coast Association of REALTORS®)
$6.80M
111 Jordan Ave
Arcadia, FL 34266
29,352 SF · 2.1 ac · Built 1970
J W Whiddens Sub
MLS #N6143959, NEXTHOME SUNCOAST.
Listing provided by Stellar MLS
$6.75M
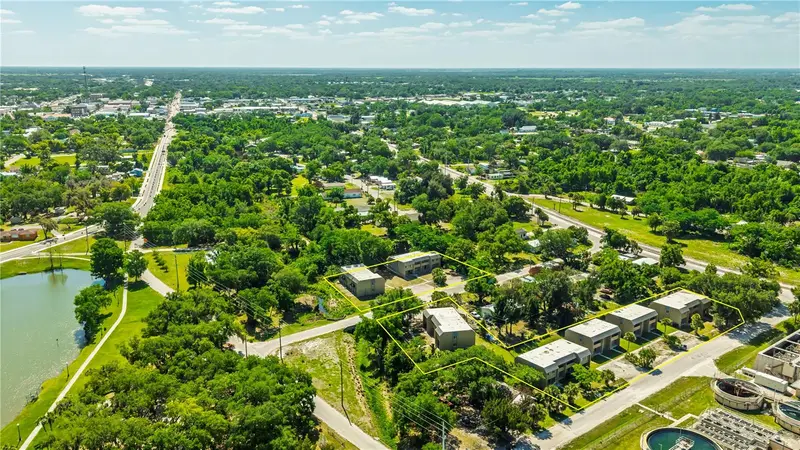
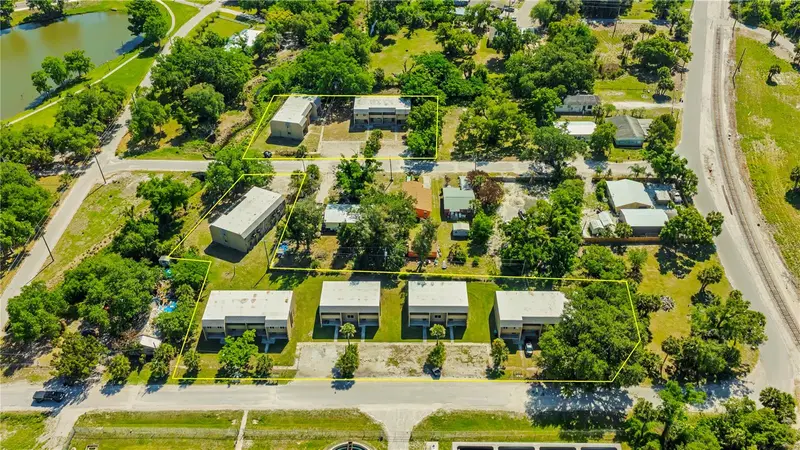
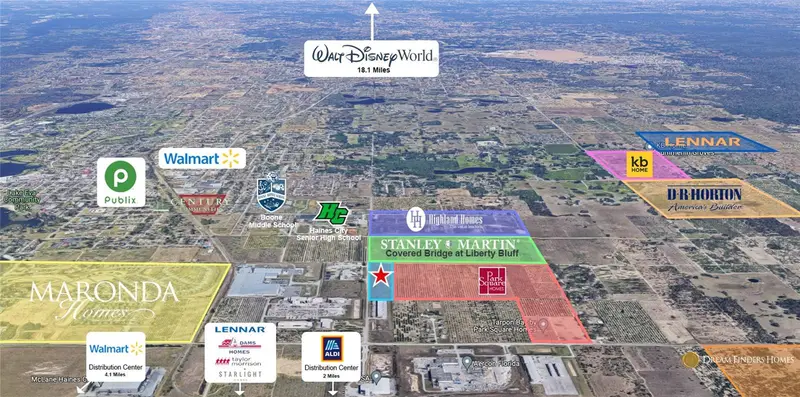
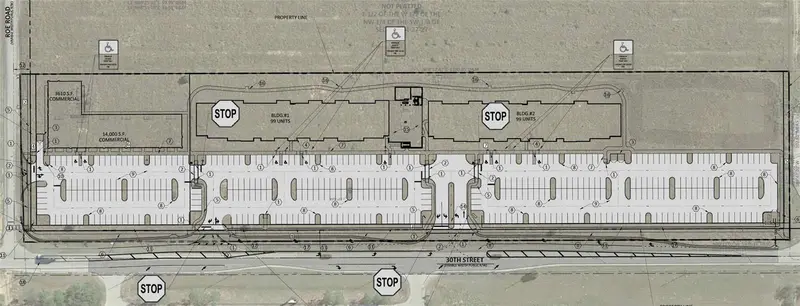
1295 S 30th St
Haines City, FL 33844
6.98 ac · Built 2024
MLS #O6247534, COMPASS FLORIDA LLC.
Listing provided by Stellar MLS
$6.50M
6925 E 21st Ave
Tampa, FL 33619
22,380 SF · 1.87 ac · Built 2025
Unplatted
MLS #TB8429881, URBAN REAL ESTATE US.
Listing provided by Stellar MLS
Listings courtesy of Stellar MLS as distributed by MLS GRID. Data deemed reliable but not guaranteed.
Browse Active Listings
Low-Rise / Walk-Up Deals on Major CRE Marketplaces
Want to see what's publicly listed? These marketplaces aggregate Florida multifamily opportunities.
Crexi
Tech-forward CRE marketplace
Growing inventory of Florida multifamily listings.
LoopNet
Largest CRE listings network
The biggest pool of multifamily listings in Florida.
CBRE Deal Flow
Institutional broker platform
Institutional multifamily opportunities across Florida.
Most institutional multifamily product trades off-market through broker relationships. tell us what you're looking for.
Frequently Asked Questions
Low-Rise / Walk-Up Investor FAQ
What's a good cap rate for Florida multifamily today?
Class A stabilized: 5.25% – 5.75%. Class B value-add: 5.75% – 6.75%. Class C workforce: 6.75% – 7.75%+. Cap rates have compressed over the decade — today's rent growth assumptions matter more than going-in yield.
Is Florida multifamily oversupplied?
Select submarkets (Orlando SW, Tampa West Chase, parts of Jacksonville) are seeing elevated deliveries and rent softening. But overall Florida is still undersupplied versus net migration — the oversupply is cyclical, not structural.
What about hurricane insurance?
Florida multifamily insurance has doubled or tripled since 2020. Budget $600 – $1,500+ per unit per year depending on coast proximity, building class, and wind mitigation features. Underwrite insurance conservatively — it's the #1 expense surprise in recent years.
Can I 1031 exchange into multifamily?
Yes. Multifamily is a strong 1031 replacement product with deep inventory and fast-close execution. Institutional-quality assets close in 30–60 days.
Is This You?
Quick Fit Check
If you nod "yes" to three or more of these, Florida multifamily deserves a major portfolio slot.
You believe in Florida's population growth tailwind for the next 10+ years.
You want access to agency debt (Fannie/Freddie) that isn't available on most CRE asset classes.
You're comfortable with active, management-intensive asset management.
You want significant bonus depreciation and cost segregation benefits.
You can underwrite to conservative insurance and CapEx assumptions.
See Available Low-Rise Apartments
Tell us about your multifamily criteria and we will send you current Florida opportunities — on and off market.