Warehouse Investments
Warehouse Properties for Sale in Florida
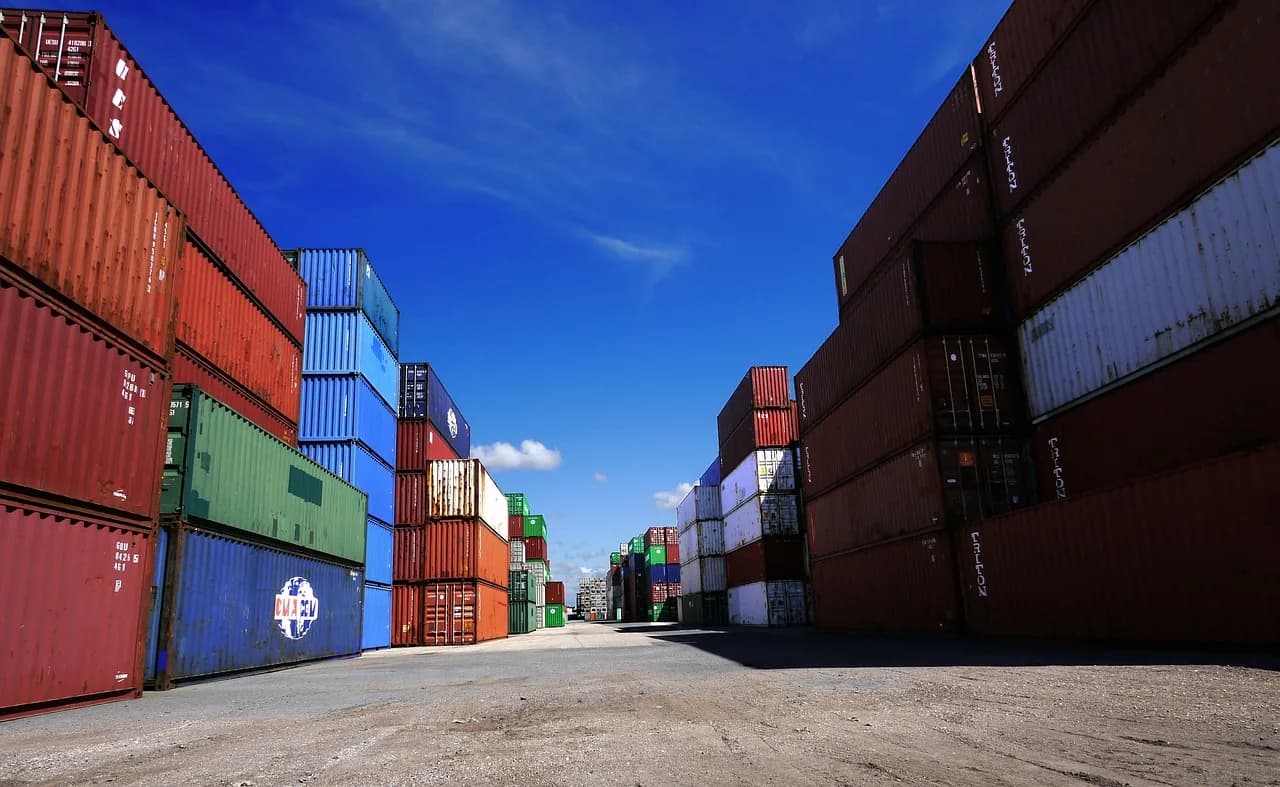
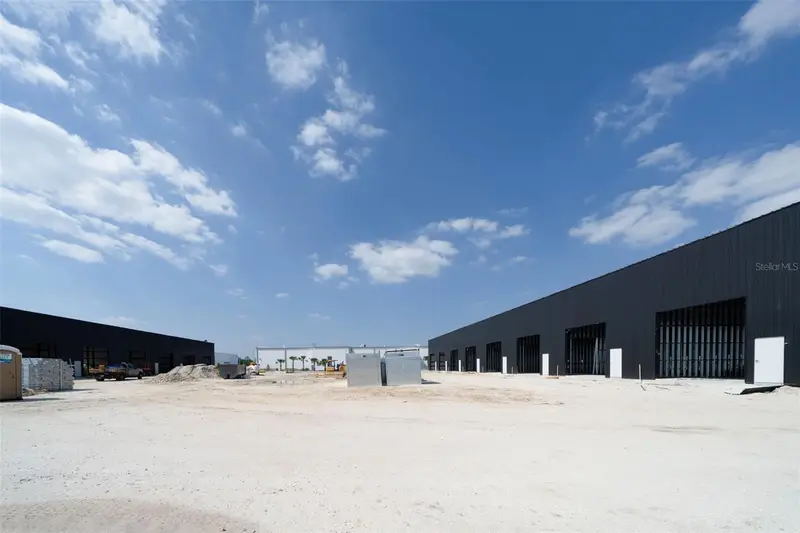
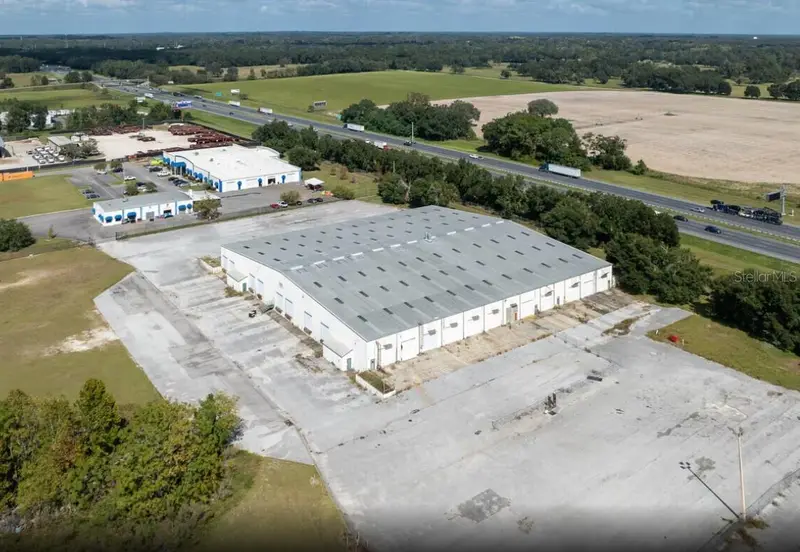
Modern bulk distribution and single-tenant warehouse buildings
Florida bulk warehouses — 150,000 SF to 1M+ SF with 32'+ clear heights, cross-docked configurations, and modern truck court depths — are among the most sought-after institutional CRE investments in America. The Florida market has seen aggressive absorption from e-commerce, 3PLs, and manufacturing tenants. Cap rates for stabilized modern bulk run 5.75% – 6.75%.
Typical Deal Size
$8M – $100M+
Single-tenant or multi-tenant bulk
Common Cap Rate
5.75% – 6.75%
Modern bulk distribution
Building Size
150k – 1M+ SF
Institutional bulk scale
Warehouse Property Formats
Modern Bulk Warehouse
32'+ clear height, cross-docked, institutional spec buildings.
Last-Mile / Infill
Smaller footprint in dense infill locations. Premium rents for e-commerce tenants.
Flex / R&D
Office front, warehouse back. Popular with growing SMB tenants.
Cold Storage
Refrigerated distribution. Thick insulation, refrigerated trailers, specialty tenant.
Industrial Outdoor Storage (IOS)
Gravel/asphalt yards for trucks, trailers, equipment. Hottest new category.
Small-Bay Multi-Tenant
Multi-tenant park of small 2k–8k SF units. Durable demand, active management.
Why Florida Is a Top-5 Industrial Market
I-4 Logistics Corridor
The Tampa-to-Orlando I-4 corridor is the most active industrial submarket in the Southeast.
Port Infrastructure
PortMiami, Port Everglades, Port Tampa Bay, and JAXPORT give Florida unmatched logistics access.
Population Inflows
Every new Florida resident adds last-mile e-commerce demand.
E-Commerce Fulfillment
Amazon, FedEx, UPS, and major 3PLs continue to build out Florida fulfillment networks.
No State Income Tax
Attracts business HQ relocations and keeps Florida cost-competitive for logistics.
Limited Land Supply
Developable industrial land is scarce near population centers, supporting existing asset values.
Warehouse Investing: Pros & Cons
Industrial remains the most durable CRE asset class — but not every building in Florida is institutional-quality.
Why Buy
Best-Performing Asset Class
Industrial has delivered the strongest NOI and rent growth in CRE for the past decade.
Deep Liquidity
Institutional capital is chasing Florida industrial product at every scale.
Short Landlord CapEx
Industrial requires meaningfully less TI than office or retail — mostly just dock seals and minor upgrades.
Strong Tenant Credit
E-commerce giants, 3PLs, and manufacturers tend to sign long leases with corporate guarantees.
Durable Secular Tailwinds
E-commerce penetration, reshoring, and supply-chain resilience all favor industrial demand.
Multiple Entry Points
From $2M owner-user flex to $100M bulk distribution, every capital scale can play.
What to Watch
Obsolescence Risk
Older low-clear-height buildings (24' or less) can become functionally obsolete for modern tenants.
Cap Rate Compression Ceiling
Industrial cap rates are already at historic tights — less room for exit compression.
Concentration Risk
Single-tenant industrial is as good as its tenant. Large vacancies can be slow to lease in secondary submarkets.
Land Availability
Finding quality Florida industrial land for development is hard — most top sites are already spoken for.
Who Warehouse Is Best Suited For
Institutional Allocators
Core / Core-Plus
REITs, pension funds, and insurance capital building scale industrial portfolios.
Why It Fits
Florida's I-4 corridor is a top-tier target market for institutional industrial capital.
Owner-Users
User-Buyers
Growing businesses buying their own warehouse or flex space to control occupancy costs.
Why It Fits
Small bay flex and freestanding industrial sell quickly to SBA-financed user-buyers.
Value-Add Sponsors
Reposition Plays
Sponsors buying functionally obsolete industrial and repositioning through capital improvements.
Why It Fits
Older Florida warehouses with low clear heights trade at big discounts to new construction.
Last-Mile Logistics
Specialty Demand
E-commerce and 3PL tenants looking for infill locations close to dense population centers.
Why It Fits
Orlando, Tampa, Jacksonville, and Miami infill sites command premium rents.
Key Warehouse Underwriting Metrics
Clear Height
32' minimum for institutional modern bulk; 24' for flex
Dock Ratio
1 dock per 10k SF for modern bulk distribution
Truck Court Depth
130'+ for class A distribution; 60' minimum for flex
Rent PSF
$9 – $16 PSF NNN for modern bulk in Florida
Power Supply
Amperage and 3-phase requirements for manufacturing tenants
Land Coverage
25–40% site coverage typical for modern distribution
Interactive Underwriting
Sample Industrial NNN Deal Pre-Loaded
A representative Orlando MSA single-tenant distribution warehouse — $9.5M purchase at a 6.5% cap rate with 12 years remaining lease term.
Property Type
Property & Revenue
Financing
Hold Period & Exit
When you sell, will the market be hotter, the same, or cooler than today? This determines your exit cap rate and sale price.
Conservative — you assume the market cools and buyers pay less per dollar of income. This is the safer assumption most lenders and institutional investors use.
Overall Deal Grade
B
IRR
10.90%
★★★★★Solid return
DSCR
1.09x
★★★★★Negative cash flow risk
Cash-on-Cash
4.82%
★★★★★Low cash yield
Equity Multiple
2.59x
★★★★★Doubled your equity
Cash Flow Analysis
NOI vs Debt Service vs Cash Flow by year
Equity Buildup
How your equity grows: loan paydown + cash flow + appreciation
Rent Schedule
Annual NOI growth over hold period
Loan Paydown
Remaining loan balance over hold period
Income & NOI
- Year 1 EGI
- $617,000
- Year 1 OPEX
- $0
- Year 1 NOI
- $617,000
- Entrance Cap Rate
- 6.49%
- Yield on Cost
- 6.49%
- 10-Yr Total NOI
- $7,073,214
Financing
- Purchase Price
- $9,500,000
- Down Payment
- $2,850,000
- Total Equity Invested
- $2,971,500
- Loan Amount
- $6,650,000
- Monthly Payment
- $47,001
- Annual Debt Service
- $564,010
- DSCR
- 1.09x
Exit & Returns
- Exit Cap Rate
- 6.99%
- Exit Year NOI
- $829,196
- Exit Value
- $11,854,576
- Selling Costs (3%)
- $355,637
- Loan Payoff
- $5,229,121
- Net Sale Proceeds
- $6,269,818
- Total Profit
- $7,702,934
Save or share
Email me this underwriting summary
Get the full metrics in your inbox — forward to lenders, partners, or yourself.
Benchmark Comparison
| Metric | Your Deal | Benchmark | Status | Insight |
|---|---|---|---|---|
| IRR | 10.90% | > 12% strong | WATCH | Moderate return |
| DSCR | 1.09x | > 1.25x lender min | FAIL | Below lender minimum — refinancing risk |
| Cash-on-Cash | 4.82% | > 6% target | WATCH | Low cash yield — appreciation play |
| Equity Multiple | 2.59x | > 2.0x strong | PASS | Doubled equity or better |
| Yield on Cost vs Exit Cap | 6.49% | 6.99% exit cap | WATCH | Buying above exit cap — assumes compression |
Suggested Offer Price
What to pay for this to be a great deal — backed into from Year 1 NOI and your financing terms so the deal meets a 1.25x DSCR lender requirement on day one.
$8,314,040
Suggested Price
at 1.25x DSCR
$9,500,000
Current Asking Price
$1,185,960
You Save
12.5%
Discount Off Asking
Deal Metrics at Suggested Price
| Metric | At Suggested | vs Current | Status | What This Means |
|---|---|---|---|---|
| DSCR (Year 1) | 1.25x | +0.16x | PASS | Bank-ready — meets standard lender minimum |
| Entrance Cap Rate | 7.42% | +0.93% | PASS | Higher yield = more income per dollar invested |
| Year 1 Cash-on-Cash | 4.73% | +2.95% | WATCH | Modest income — grows with rent bumps |
| Down Payment | $2,494,212 | -$355,788 less | SAVINGS | $2,494,212 down + $113,198 closing = $2,607,410 total cash to close |
| Loan Amount | $5,819,828 | -$830,172 | $41,133/mo | $5,819,828 loan at 7.0% = $41,133/mo debt service |
Offer $8,314,040 (12.5% below asking) to hit 1.25x DSCR. You'd need $2,494,212 down vs $2,850,000 today — saving $355,788 in equity. Monthly payment drops from $47,001 to $41,133.
Sensitivity Matrix
Exit value at different cap rate and NOI growth combinations
| Exit Cap / Growth | 0% Growth | 1% Growth | 2% Growth | 3% Growth | 4% Growth |
|---|---|---|---|---|---|
| 5.49% | $11,228,927 | $12,403,721 | $13,688,000 | $15,090,739 | $16,621,555 |
| 5.99% | $10,292,362 | $11,369,170 | $12,546,332 | $13,832,073 | $15,235,210 |
| 6.49% | $9,500,000 | $10,493,910 | $11,580,447 | $12,767,206 | $14,062,321 |
| 6.99% | $8,820,918 | $9,743,781 | $10,752,650 | $11,854,576 | $13,057,113 |
| 7.49% | $8,232,444 | $9,093,740 | $10,035,303 | $11,063,716 | $12,186,028 |
Green = exit value exceeds purchase price. Red = exit value below purchase price.
Year-by-Year Cash Flows
Metric Glossary
IRR
Internal Rate of Return — the annualized return on every dollar you invest, accounting for timing of cash flows.
Equity Multiple
Total money returned divided by total money invested. 2.0x = you doubled your money.
Cash-on-Cash
Annual cash flow as a percentage of your invested equity. Measures what the property pays you now.
DSCR
Debt Service Coverage Ratio — how many times NOI covers the mortgage. Lenders require 1.25x minimum.
Cap Rate
NOI divided by property value. The return assuming all-cash purchase. Lower cap = higher price.
NOI
Net Operating Income — rent minus operating expenses, before mortgage payments.
Yield on Cost
Year 1 NOI divided by purchase price. The cap rate you created for yourself as a buyer.
Exit Cap
The assumed cap rate when you sell. Higher exit cap = lower sale price (conservative).
For informational and educational purposes only. Not financial or investment advice. Consult a licensed professional before making investment decisions.
Want to underwrite a different asset class? Open the full Deal Analyzer
Browse Live Warehouse Listings
Current warehouse properties for sale across Central Florida — live from Stellar MLS, no Crexi or LoopNet detour.
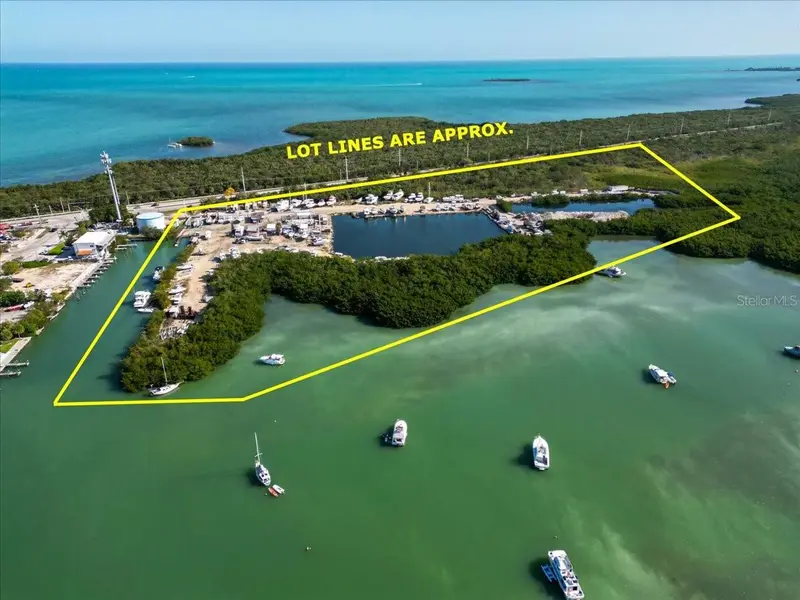
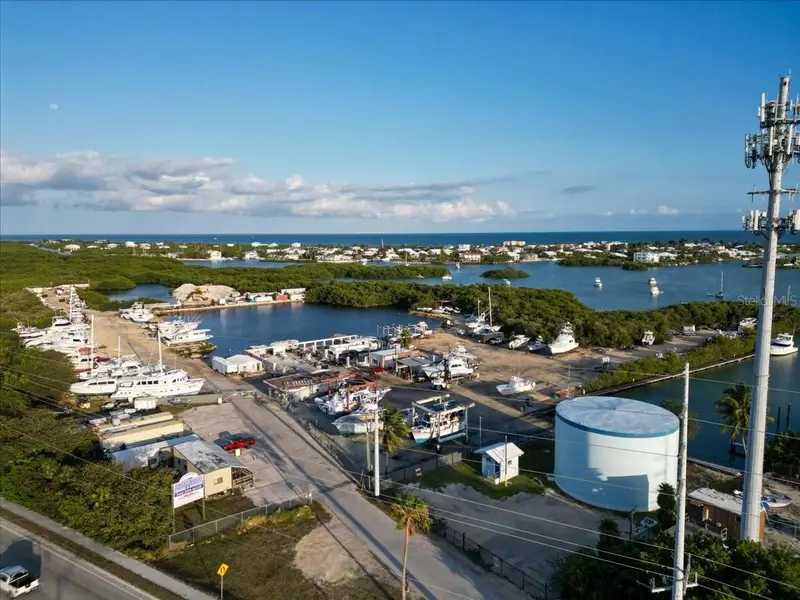
$12.90M
13900 Overseas Hwy
Marathon, FL 33050
21 ac · Built 1979
Driftwood Estates
MLS #TB8362905, EQUITY REALTY SUNCOAST.
Listing provided by Stellar MLS
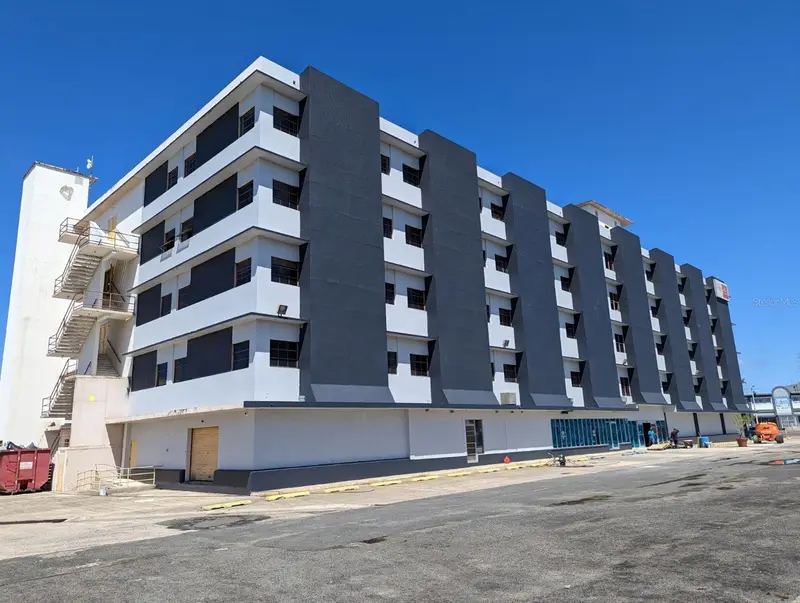
$12.90M
602 Barbosa Ave
San Juan, PR 00926
2.9 ac · Built 1990
Barbosa 602
MLS #PR9092950, WINER PROPERTY GROUP.
Listing provided by Stellar MLS
$12.75M
4707 County Road 156
Wildwood, FL 34785
75,000 SF · 5.72 ac · Built 2023
MLS #G5107761, GRIZZARD COMMERCIAL REALESTATE.
Listing provided by Stellar MLS
$10.75M
8411-8419 Duffie Dr
Punta Gorda, FL 33982
5 ac · Built 2026
Woodland Acres
MLS #C7526720, PREMIERE PLUS REALTY COMPANY.
Listing provided by Stellar MLS
$9.95M
6608 Marina Dr
Holmes Beach, FL 34217
6,292 SF · 1.94 ac · Built 1960
MLS #TB8415541, VIRTUAL REALTY INC.
Listing provided by Stellar MLS
$8.00M
5407 Nw 44th Ave
Ocala, FL 34482
11.73 ac · Built 1987
Neighborhood 9919
MLS #OM717067, COLDWELL BANKER ELLISON REALTY O.
Listing provided by Stellar MLS
Listings courtesy of Stellar MLS as distributed by MLS GRID. Data deemed reliable but not guaranteed.
Browse Active Listings
Warehouse Deals on Major CRE Marketplaces
Want to see what's publicly listed? These marketplaces aggregate Florida industrial.
Crexi
Tech-forward CRE marketplace
Growing inventory of Florida industrial listings.
LoopNet
Largest CRE listings network
The biggest pool of industrial listings in Florida.
CBRE Deal Flow
Institutional broker platform
Institutional industrial opportunities across Florida.
Institutional industrial product often trades off-market directly between REITs and sponsors. tell us what you're looking for.
Frequently Asked Questions
Warehouse Investor FAQ
Why is Florida industrial so in-demand right now?
Florida combines population growth, port infrastructure, the I-4 corridor, and no state income tax. E-commerce fulfillment, 3PL expansion, and last-mile logistics have driven Florida industrial to among the best NOI growth of any CRE asset class.
What's the difference between bulk distribution and flex?
Modern bulk distribution: 150,000 – 1M+ SF, 32'+ clear height, cross-docked, institutional tenants. Flex: 15,000 – 80,000 SF, office-front warehouse, smaller tenants, 18–24' clear. Flex trades at wider cap rates and appeals to SMB buyers.
What is IOS (Industrial Outdoor Storage)?
IOS is fenced, paved/graveled outdoor yards used to store trucks, trailers, containers, equipment, and materials. It has emerged as one of the hottest new industrial categories because supply is constrained by zoning and demand is surging from 3PL and logistics tenants.
How do I underwrite tenant rollover in industrial?
Modern bulk in a strong submarket releases quickly — 6–12 months vacancy is typical. Older or specialized buildings in secondary markets can take much longer. Always underwrite market rent, downtime, and releasing TI in your year-10 cash flow.
Is This You?
Quick Fit Check
If you nod "yes" to three or more of these, Florida industrial deserves a top-tier spot in your portfolio.
You want exposure to the best-performing CRE asset class of the past decade.
You believe in the durability of e-commerce and last-mile logistics demand.
You value low landlord CapEx and simple lease structures.
You can execute on Florida land constraints as a competitive moat.
You have capital to compete with institutional allocators on quality product.
See Available Warehouse Properties
Tell us about your industrial investment criteria and we will send you current Florida opportunities.