Industrial Outdoor Storage (IOS)
Industrial Outdoor Storage (IOS) in Florida
The hottest new industrial category — fenced yards for trucks, trailers, and equipment
Industrial Outdoor Storage (IOS) is the fastest-emerging CRE investment category of the past five years. These are fenced, paved or graveled outdoor yards — 2 to 15+ acres — used to store tractor-trailers, containers, construction equipment, materials, and fleet vehicles. IOS supply is structurally constrained by zoning while demand has surged from 3PL, logistics, and last-mile tenants. Florida is among the top IOS markets nationally with active demand in Orlando, Tampa, Jacksonville, and the I-4 corridor. Cap rates range 6.75%–8.00% for institutional-quality product.
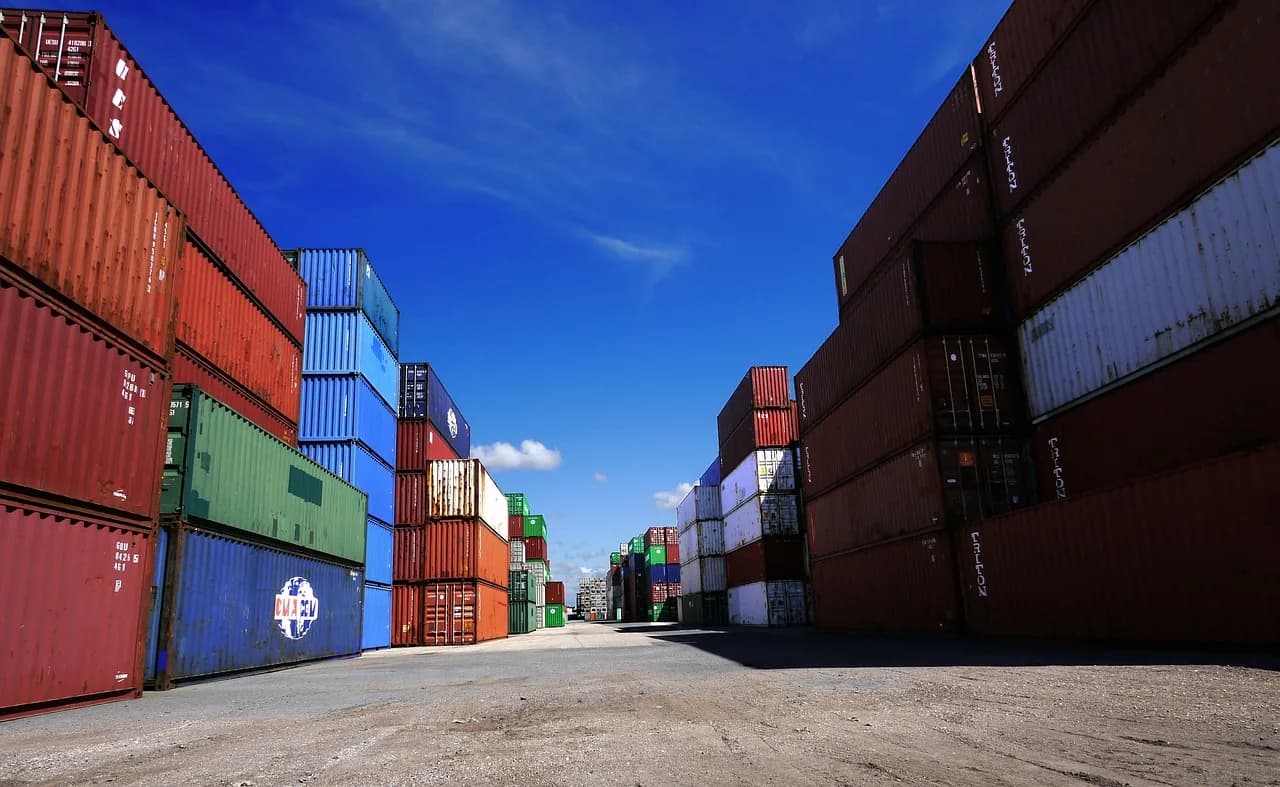
Watch the Breakdown
Industrial Outdoor Storage, Explained
What an IOS yard actually is, why permitted supply is scarce, the planning ranges for cap rates and rent per acre, and the diligence that decides the deal.
Typical Deal Size
$2M – $25M
Single-tenant or multi-user IOS yards
Common Cap Rate
6.75% – 8.00%
Compressing as institutional capital enters
Site Size
2 – 15+ acres
Fenced, paved, or graveled yards
Industrial Outdoor Storage (IOS) Property Formats
Modern Bulk Warehouse
32'+ clear height, cross-docked, institutional spec buildings.
Last-Mile / Infill
Smaller footprint in dense infill locations. Premium rents for e-commerce tenants.
Flex / R&D
Office front, warehouse back. Popular with growing SMB tenants.
Cold Storage
Refrigerated distribution. Thick insulation, refrigerated trailers, specialty tenant.
Industrial Outdoor Storage (IOS)
Gravel/asphalt yards for trucks, trailers, equipment. Hottest new category.
Small-Bay Multi-Tenant
Multi-tenant park of small 2k–8k SF units. Durable demand, active management.
Why Florida Is a Top-5 Industrial Market
I-4 Logistics Corridor
The Tampa-to-Orlando I-4 corridor is the most active industrial submarket in the Southeast.
Port Infrastructure
PortMiami, Port Everglades, Port Tampa Bay, and JAXPORT give Florida unmatched logistics access.
Population Inflows
Every new Florida resident adds last-mile e-commerce demand.
E-Commerce Fulfillment
Amazon, FedEx, UPS, and major 3PLs continue to build out Florida fulfillment networks.
No State Income Tax
Attracts business HQ relocations and keeps Florida cost-competitive for logistics.
Limited Land Supply
Developable industrial land is scarce near population centers, supporting existing asset values.
Industrial Outdoor Storage (IOS) Investing: Pros & Cons
Industrial remains the most durable CRE asset class — but not every building in Florida is institutional-quality.
Why Buy
Structural Supply Constraint
Zoning restrictions make new IOS supply almost impossible near population centers — existing sites hold value.
Surging Institutional Demand
REITs and PE funds are aggressively acquiring IOS portfolios, compressing cap rates and providing reliable exits.
Low CapEx
IOS is the most operationally simple industrial format — minimal building, no roof, no HVAC. Maintenance is largely pavement and fencing.
Short Lease Terms = Rent Mark-to-Market
1–3 year leases let you capture rent growth faster than NNN retail or multi-year industrial leases.
Multiple Tenant Types
Logistics, 3PL, construction, fleet management, automotive, and container storage all compete for IOS in Florida.
Land Value Floor
IOS sites typically sit on land with high-and-better-use potential — you're buying land, not just operating income.
What to Watch
Zoning Complexity
IOS often requires specific industrial zoning (I-2, HI, or equivalent) that can be hard to find and harder to entitle.
Environmental Liability
Prior industrial users can leave contamination. Phase I/II environmental diligence is non-negotiable on IOS acquisitions.
Short Leases = Rollover Risk
The same short leases that allow rent growth also mean higher turnover risk in a softening logistics cycle.
Limited Financing Options
IOS financing is less standardized than warehouse debt — often requires specialized lenders and higher LTV constraints.
Stormwater Compliance
Florida paved yards require stormwater permitting and retention compliance. Verify before closing.
Who Industrial Outdoor Storage (IOS) Is Best Suited For
IOS Portfolio Aggregators
Institutional PE / REIT
Major institutional buyers building scaled IOS portfolios across Sun Belt markets.
Why It Fits
Florida IOS trades in line with other top Sun Belt IOS markets. Active institutional bid provides reliable exit.
Private Industrial Investors
Value-Add Acquirers
High-net-worth investors and family offices buying 2–10 acre IOS sites on short-term leases with rent-push potential.
Why It Fits
IOS offers superior yield to NNN retail with simpler lease structure and no building maintenance.
1031 Exchange Buyers
Tax-Deferred Exchange
Investors rolling out of NNN retail or multifamily seeking yield-accretive replacement property.
Why It Fits
IOS closes quickly and offers higher going-in cap rates than most NNN alternatives.
Owner-Operators
User-Buyers
Trucking companies, contractors, fleet operators, and construction firms buying their own yard.
Why It Fits
Owner-user IOS demand in Florida is strong — both SBA 504 and conventional financing available.
Key Industrial Outdoor Storage (IOS) Underwriting Metrics
Rent PSF / Acre
$40,000 – $90,000 per acre per year in Florida IOS (paved, secured, I-4 corridor)
Pavement Condition
Assess thickness, drainage, and remaining life — the primary maintenance CapEx item
Fencing & Security
6'+ chain-link or security perimeter with gate access control; lighting requirements vary by tenant
Stormwater Permits
Verify active SWFPMD / SJRWMD permits and no outstanding compliance orders
Zoning Confirmation
Confirm IOS use is permitted by right — not a conditional use permit that could be revoked
Phase I Environmental
Mandatory on all IOS acquisitions given prior use history
Lease Rollover Risk
Model 2–4 months downtime between tenants on short-term IOS leases
Interactive Underwriting
Sample IOS Deal Pre-Loaded
A representative Central Florida IOS yard — 6 paved, fenced acres on the I-4 corridor at $4.2M, leased to a regional 3PL operator at 7.25% cap.
Property Type
Property & Revenue
Financing
Hold Period & Exit
When you sell, will the market be hotter, the same, or cooler than today? This determines your exit cap rate and sale price.
Conservative — you assume the market cools and buyers pay less per dollar of income. This is the safer assumption most lenders and institutional investors use.
Overall Deal Grade
B+
IRR
14.09%
★★★★★Strong return
DSCR
1.18x
★★★★★Below lender minimum
Cash-on-Cash
5.54%
★★★★★Acceptable cash yield
Equity Multiple
2.36x
★★★★★Doubled your equity
Cash Flow Analysis
NOI vs Debt Service vs Cash Flow by year
Equity Buildup
How your equity grows: loan paydown + cash flow + appreciation
Rent Schedule
Annual NOI growth over hold period
Loan Paydown
Remaining loan balance over hold period
Income & NOI
- Year 1 EGI
- $304,500
- Year 1 OPEX
- $0
- Year 1 NOI
- $304,500
- Entrance Cap Rate
- 7.25%
- Yield on Cost
- 7.25%
- 7-Yr Total NOI
- $2,405,031
Financing
- Purchase Price
- $4,200,000
- Down Payment
- $1,470,000
- Total Equity Invested
- $1,527,300
- Loan Amount
- $2,730,000
- Monthly Payment
- $21,577
- Annual Debt Service
- $258,927
- DSCR
- 1.18x
Exit & Returns
- Exit Cap Rate
- 7.50%
- Exit Year NOI
- $400,701
- Exit Value
- $5,342,683
- Selling Costs (3%)
- $160,280
- Loan Payoff
- $2,175,849
- Net Sale Proceeds
- $3,006,554
- Total Profit
- $3,599,094
Save or share
Email me this underwriting summary
Get the full metrics in your inbox — forward to lenders, partners, or yourself.
Benchmark Comparison
| Metric | Your Deal | Benchmark | Status | Insight |
|---|---|---|---|---|
| IRR | 14.09% | > 12% strong | PASS | Strong annualized return |
| DSCR | 1.18x | > 1.25x lender min | WATCH | Below lender minimum — refinancing risk |
| Cash-on-Cash | 5.54% | > 6% target | WATCH | Low cash yield — appreciation play |
| Equity Multiple | 2.36x | > 2.0x strong | PASS | Doubled equity or better |
| Yield on Cost vs Exit Cap | 7.25% | 7.50% exit cap | WATCH | Buying above exit cap — assumes compression |
Suggested Offer Price
What to pay for this to be a great deal — backed into from Year 1 NOI and your financing terms so the deal meets a 1.25x DSCR lender requirement on day one.
$3,951,381
Suggested Price
at 1.25x DSCR
$4,200,000
Current Asking Price
$248,619
You Save
5.9%
Discount Off Asking
Deal Metrics at Suggested Price
| Metric | At Suggested | vs Current | Status | What This Means |
|---|---|---|---|---|
| DSCR (Year 1) | 1.25x | +0.07x | PASS | Bank-ready — meets standard lender minimum |
| Entrance Cap Rate | 7.71% | +0.46% | PASS | Higher yield = more income per dollar invested |
| Year 1 Cash-on-Cash | 4.23% | +1.25% | WATCH | Modest income — grows with rent bumps |
| Down Payment | $1,382,983 | -$87,017 less | SAVINGS | $1,382,983 down + $55,684 closing = $1,438,667 total cash to close |
| Loan Amount | $2,568,398 | -$161,602 | $20,300/mo | $2,568,398 loan at 7.25% = $20,300/mo debt service |
Offer $3,951,381 (5.9% below asking) to hit 1.25x DSCR. You'd need $1,382,983 down vs $1,470,000 today — saving $87,017 in equity. Monthly payment drops from $21,577 to $20,300.
Sensitivity Matrix
Exit value at different cap rate and NOI growth combinations
| Exit Cap / Growth | 0% Growth | 1% Growth | 2% Growth | 3% Growth | 4% Growth |
|---|---|---|---|---|---|
| 6.25% | $4,872,000 | $5,223,443 | $5,596,397 | $5,991,945 | $6,411,220 |
| 6.75% | $4,511,111 | $4,836,522 | $5,181,849 | $5,548,098 | $5,936,314 |
| 7.25% | $4,200,000 | $4,502,968 | $4,824,480 | $5,165,470 | $5,526,913 |
| 7.75% | $3,929,032 | $4,212,454 | $4,513,223 | $4,832,214 | $5,170,338 |
| 8.25% | $3,690,909 | $3,957,154 | $4,239,694 | $4,539,353 | $4,856,985 |
Green = exit value exceeds purchase price. Red = exit value below purchase price.
Year-by-Year Cash Flows
Metric Glossary
IRR
Internal Rate of Return — the annualized return on every dollar you invest, accounting for timing of cash flows.
Equity Multiple
Total money returned divided by total money invested. 2.0x = you doubled your money.
Cash-on-Cash
Annual cash flow as a percentage of your invested equity. Measures what the property pays you now.
DSCR
Debt Service Coverage Ratio — how many times NOI covers the mortgage. Lenders require 1.25x minimum.
Cap Rate
NOI divided by property value. The return assuming all-cash purchase. Lower cap = higher price.
NOI
Net Operating Income — rent minus operating expenses, before mortgage payments.
Yield on Cost
Year 1 NOI divided by purchase price. The cap rate you created for yourself as a buyer.
Exit Cap
The assumed cap rate when you sell. Higher exit cap = lower sale price (conservative).
For informational and educational purposes only. Not financial or investment advice. Consult a licensed professional before making investment decisions.
Want to underwrite a different asset class? Open the full Deal Analyzer
Browse Live Industrial & Warehouse Listings
The MLS files industrial outdoor storage (ios) under its industrial & warehouse class, so this is the live inventory closest to what you're after. Tell us the specifics and we'll source the rest off-market.
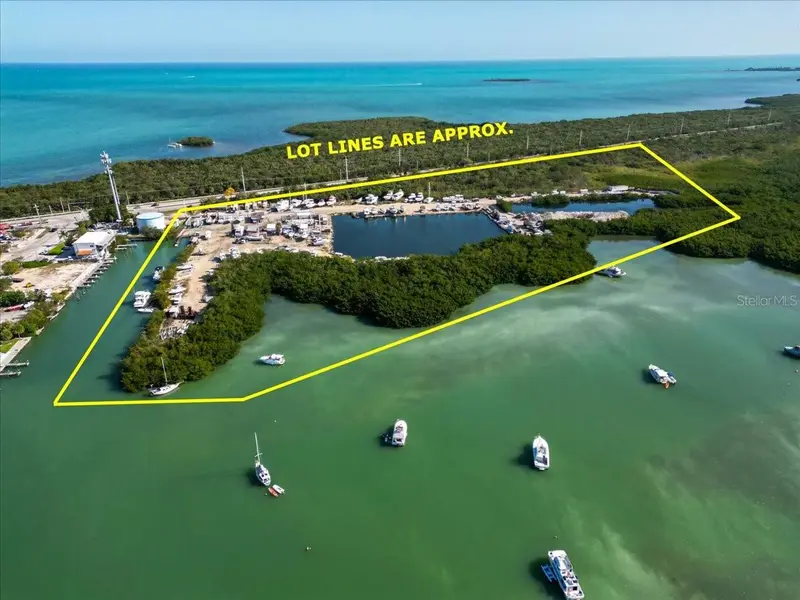
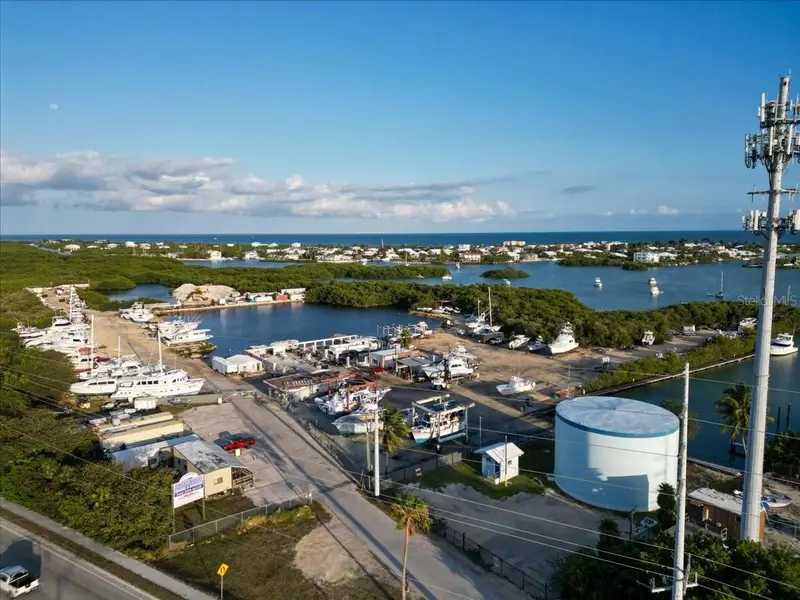

$12.90M
13900 Overseas Hwy
Marathon, FL 33050
21 ac · Built 1979
Driftwood Estates
MLS #TB8362905, EQUITY REALTY SUNCOAST.
Listing provided by Stellar MLS
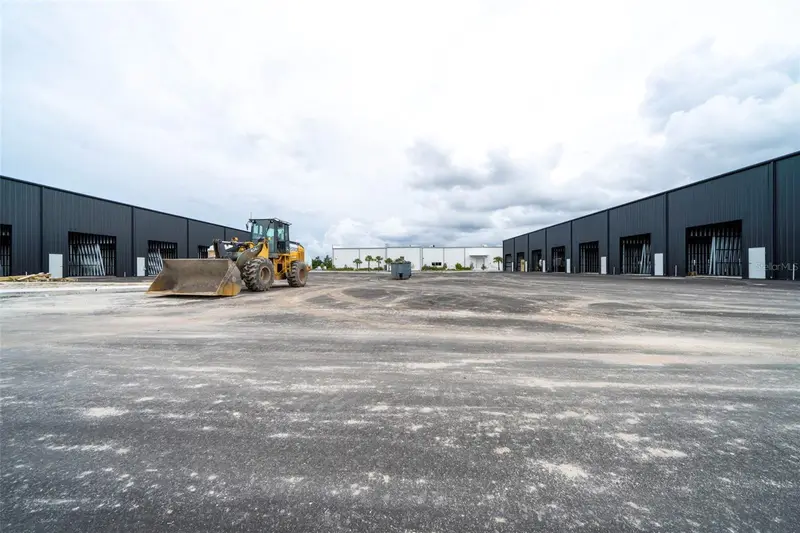
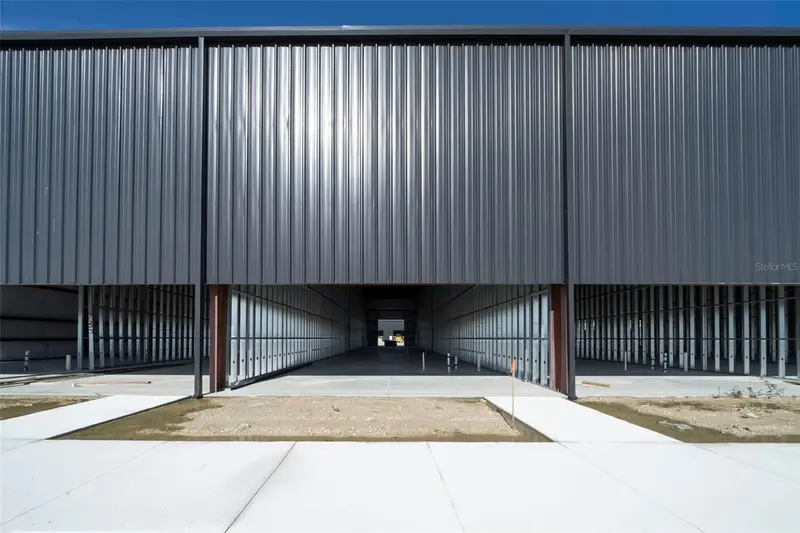
$10.75M
8411-8419 Duffie Dr
Punta Gorda, FL 33982
5 ac · Built 2026
Woodland Acres
MLS #C7526720, PREMIERE PLUS REALTY COMPANY.
Listing provided by Stellar MLS
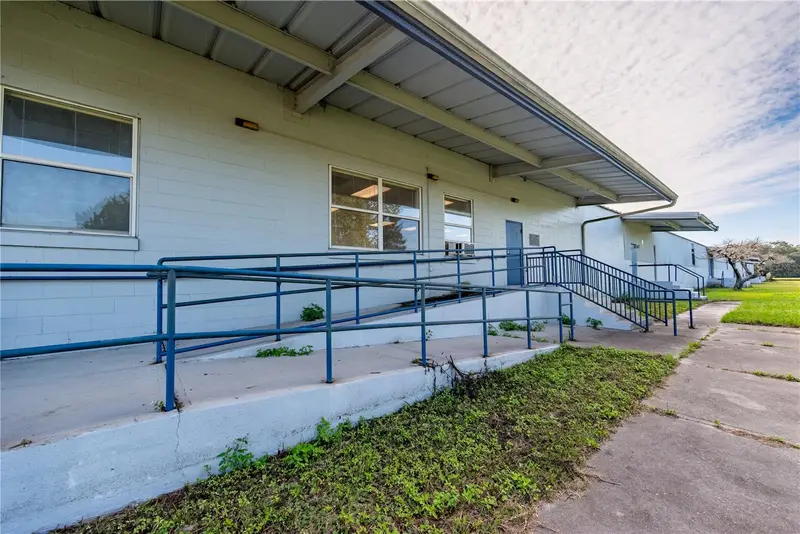
$10.00M
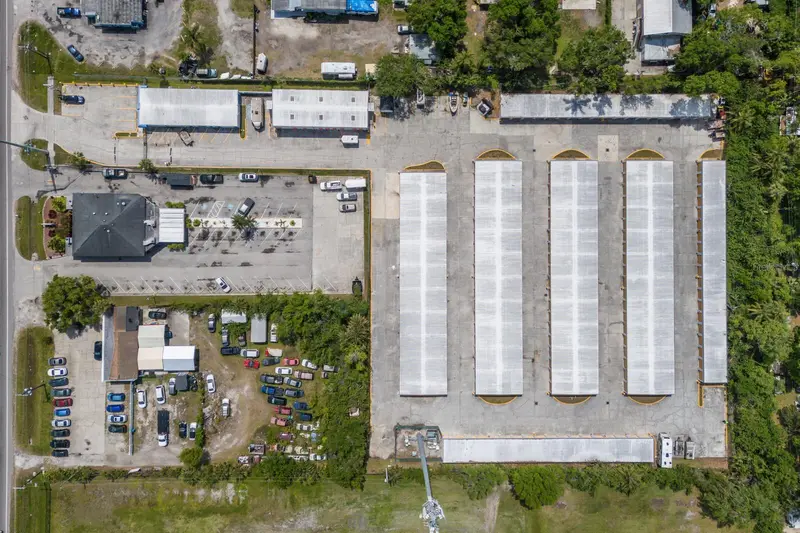
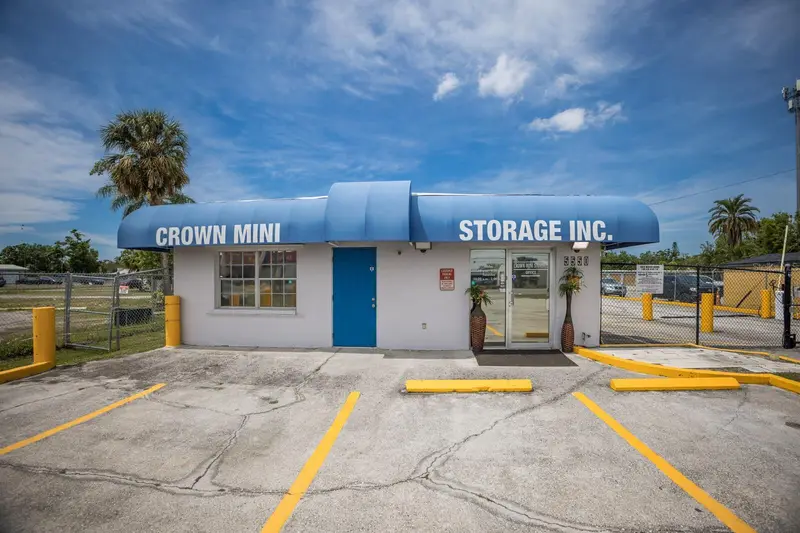
14281 Us Hwy 301 Hwy
Starke, FL 32091
99,750 SF · 30.77 ac · Built 1965
MLS #GC543371, COLDWELL BANKER SMITH AND SMITH REALTY.
Listing provided by Stellar MLS
$8.00M
5550 15th St E
Bradenton, FL 34203
49,800 SF · 3.26 ac · Built 1992
MLS #A4646002, GB INTERNATIONAL REALTY.
Listing provided by Stellar MLS
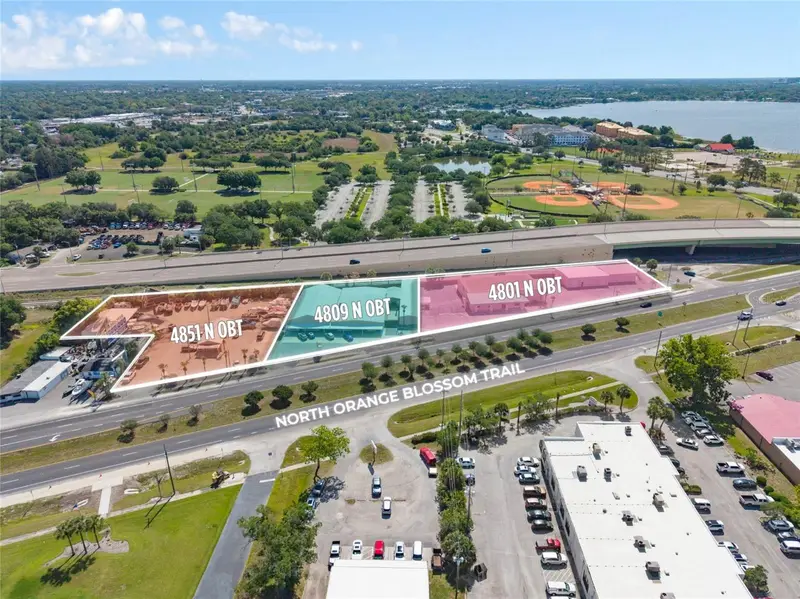
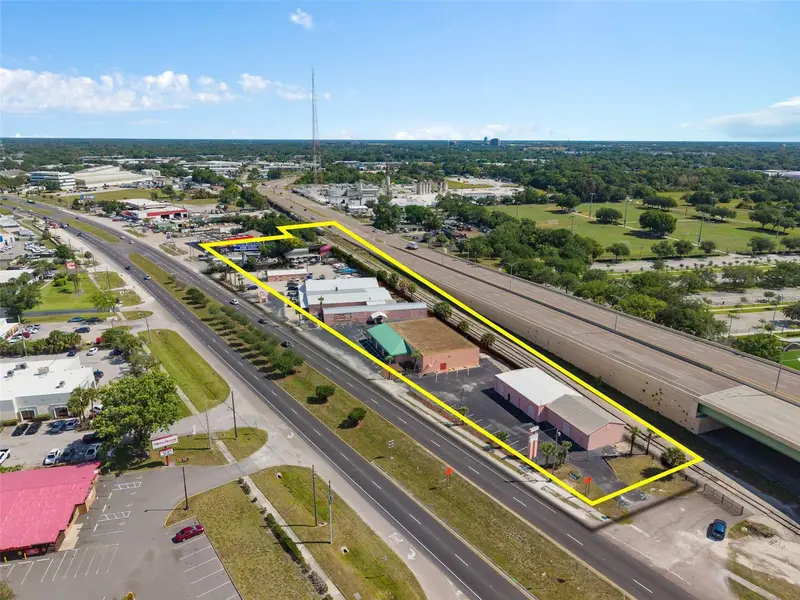
$7.50M
4809 N Orange Blossom Trl
Orlando, FL 32810
36,048 SF · 2.54 ac · Built 1960
MLS #O6418001, RE/MAX ASSURED.
Listing provided by Stellar MLS


$6.95M
1101 Albright Rd
Sanford, FL 32771
13,675 SF · 5.09 ac · Built 1985
A F G Vegetable Tr
MLS #O6437446, SLOANE REALTY, LLC.
Listing provided by Stellar MLS
Listings courtesy of Stellar MLS as distributed by MLS GRID. Data deemed reliable but not guaranteed.
Browse Active Listings
Industrial Outdoor Storage (IOS) Deals on Major CRE Marketplaces
Want to see what's publicly listed? These marketplaces aggregate Florida industrial.
Crexi
Tech-forward CRE marketplace
Growing inventory of Florida industrial listings.
LoopNet
Largest CRE listings network
The biggest pool of industrial listings in Florida.
CBRE Deal Flow
Institutional broker platform
Institutional industrial opportunities across Florida.
Institutional industrial product often trades off-market directly between REITs and sponsors. tell us what you're looking for.
Frequently Asked Questions
Industrial Outdoor Storage (IOS) Investor FAQ
What is industrial outdoor storage (IOS)?
IOS is a fenced, paved or graveled outdoor yard used to store tractor-trailers, shipping containers, construction equipment, fleet vehicles, and materials. There is typically a small guard shack or minimal office building, but the value is almost entirely in the outdoor storage functionality.
Why is IOS so popular with investors right now?
Supply is structurally constrained — industrial zoning that allows outdoor storage is scarce near population centers, and local opposition makes new entitlements difficult. Meanwhile, demand has surged from e-commerce last-mile logistics, 3PLs, and construction. Institutional capital (REITs and PE funds) has entered the category aggressively, compressing cap rates while providing reliable exits.
What cap rates are IOS properties trading at in Florida?
Florida IOS typically trades 6.75%–8.00% for institutional-quality product. Paved, secured, well-located sites with strong tenants on the I-4 corridor trade tighter (6.75%–7.25%). Older or partially improved sites in secondary markets trade wider (7.5%–8.5%). Cap rates have compressed 150–200 bps over the past three years as institutional capital has entered.
What due diligence matters most on an IOS acquisition?
Phase I environmental is non-negotiable — prior industrial use creates legacy contamination risk. Confirm zoning permits IOS by right (not conditional use). Inspect pavement thickness and drainage. Verify stormwater permits are current. Review lease terms carefully — many IOS leases have 30-day termination rights that affect value.
How does IOS financing work?
IOS financing is less standardized than warehouse lending. Most deals require specialized industrial lenders, life companies, or debt funds. LTVs typically run 60%–70%. Some deals qualify for SBA 504 if owner-occupied. Expect higher rate spreads than conventional warehouse debt due to the shorter lease terms and specialty nature.
Is This You?
Quick Fit Check
If you nod "yes" to three or more of these, Florida IOS deserves serious portfolio consideration.
You believe logistics and last-mile e-commerce demand will continue to grow.
You want higher yield than NNN retail with simpler lease structure and no building maintenance.
You can execute environmental diligence and understand zoning nuance.
You want exposure to a category attracting major institutional capital and cap rate compression.
You're interested in the land value floor beneath operating income.
See Available IOS Properties
Tell us your IOS investment criteria — site size, market, and capital — and we will source Florida IOS opportunities on and off market.
Related Resources
Three-Phase Power Guide
Service voltages, amperage by tenant type, how to verify capacity, and what an upgrade costs in Florida.
Learn more →Florida Industrial Market Report
Cap rates, vacancy, and absorption trends across Orlando, Tampa, Jacksonville, and the I-4 corridor.
Learn more →What's My Industrial Property Worth?
Free instant value estimator by building format, county, NOI, and lease term.
Learn more →Central Florida Industrial Property
A deeper look at the I-4 corridor's warehouse, distribution, and flex inventory.
Learn more →Orlando Industrial Cap Rates
Submarket-level cap rate data for Orlando-metro industrial product.
Learn more →